



If you work in molecular modeling, you’re probably familiar with the challenges of ensuring protein structures are accurate and optimized before simulations or analyses. One of the most practical tools for protein backbone analysis is the Ramachandran Plot, and with SAMSON’s Interactive Ramachandran Plot app, this crucial step becomes both intuitive and efficient. Let’s dive into how this tool can assist you in visualizing and improving protein structures for research or design workflows.
What is the Ramachandran Plot?
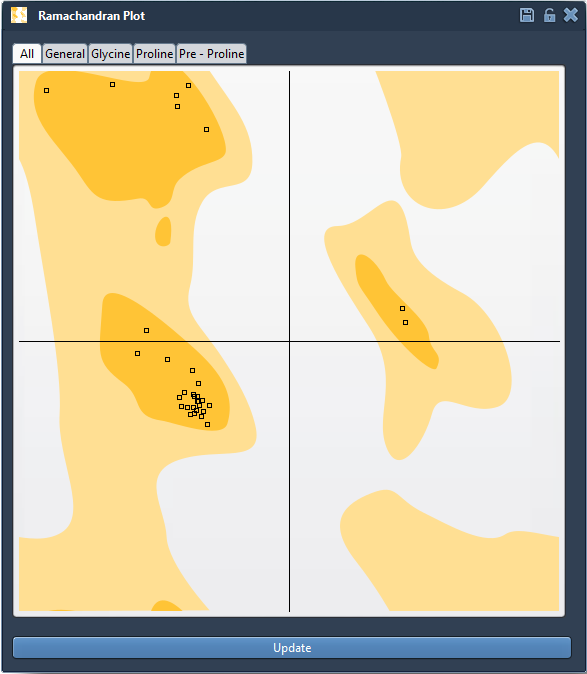
To set the stage, a Ramachandran plot visualizes the ϕ (phi) and ψ (psi) dihedral angles of a protein’s backbone. These angles define the conformational preferences of amino acid residues based on steric and energetic constraints. In a Ramachandran plot:
- Yellow areas: Represent energetically favorable configurations.
- White areas: Indicate disallowed conformations.
This allows you to spot residues that may be strained or poorly placed, making it an indispensable visualization for structure validation and refinement.
Using the App: A Quick Overview
The Interactive Ramachandran Plot app in SAMSON integrates seamlessly into your workflow, allowing you to load a protein structure and analyze its dihedral angles step-by-step. For example, here’s a quick look at one such analysis based on PDB ID 1YRF:
Loading a Protein Structure
- Navigate to Home > Fetch in SAMSON.
- Enter the PDB code of the protein you want to analyze (e.g.,
1YRF). - Press the Load button to fetch and display the structure.
Opening the Ramachandran Plot App
Once the structure is ready, initiate the app via Home > Apps > Biology > Ramachandran plot. After loading the protein, click Update to generate the plot. You’ll see something like this:
Exploring and Optimizing Residues
You can leverage the Ramachandran plot to validate and adjust residues:
Visualizing Individual Residues
Click on any dot in the plot (e.g., one corresponding to a proline residue). A corresponding region of the protein will be highlighted in the viewport. The status bar also provides real-time dihedral angle values:

Interactive Editing with Drag-and-Drop
To correct unfavorable residues, you can interactively adjust their positions directly on the plot:
- Click and drag a point in the plot to modify its phi and psi angles.
- The 3D structure updates dynamically in real time to reflect those changes.
- If needed, undo modifications with a simple Ctrl/Cmd + Z shortcut.
This live feedback ensures efficient adjustments that keep the structure within energetically favorable regions.
Enhanced Flexibility with the Twister Editor
If you prefer 3D manipulation, the Twister Editor is another option:
- Select the Twister icon in SAMSON’s viewport menu.
- Twist the 3D structure directly to refine its backbone geometry.
- Observe how the Ramachandran plot updates as you make these edits:
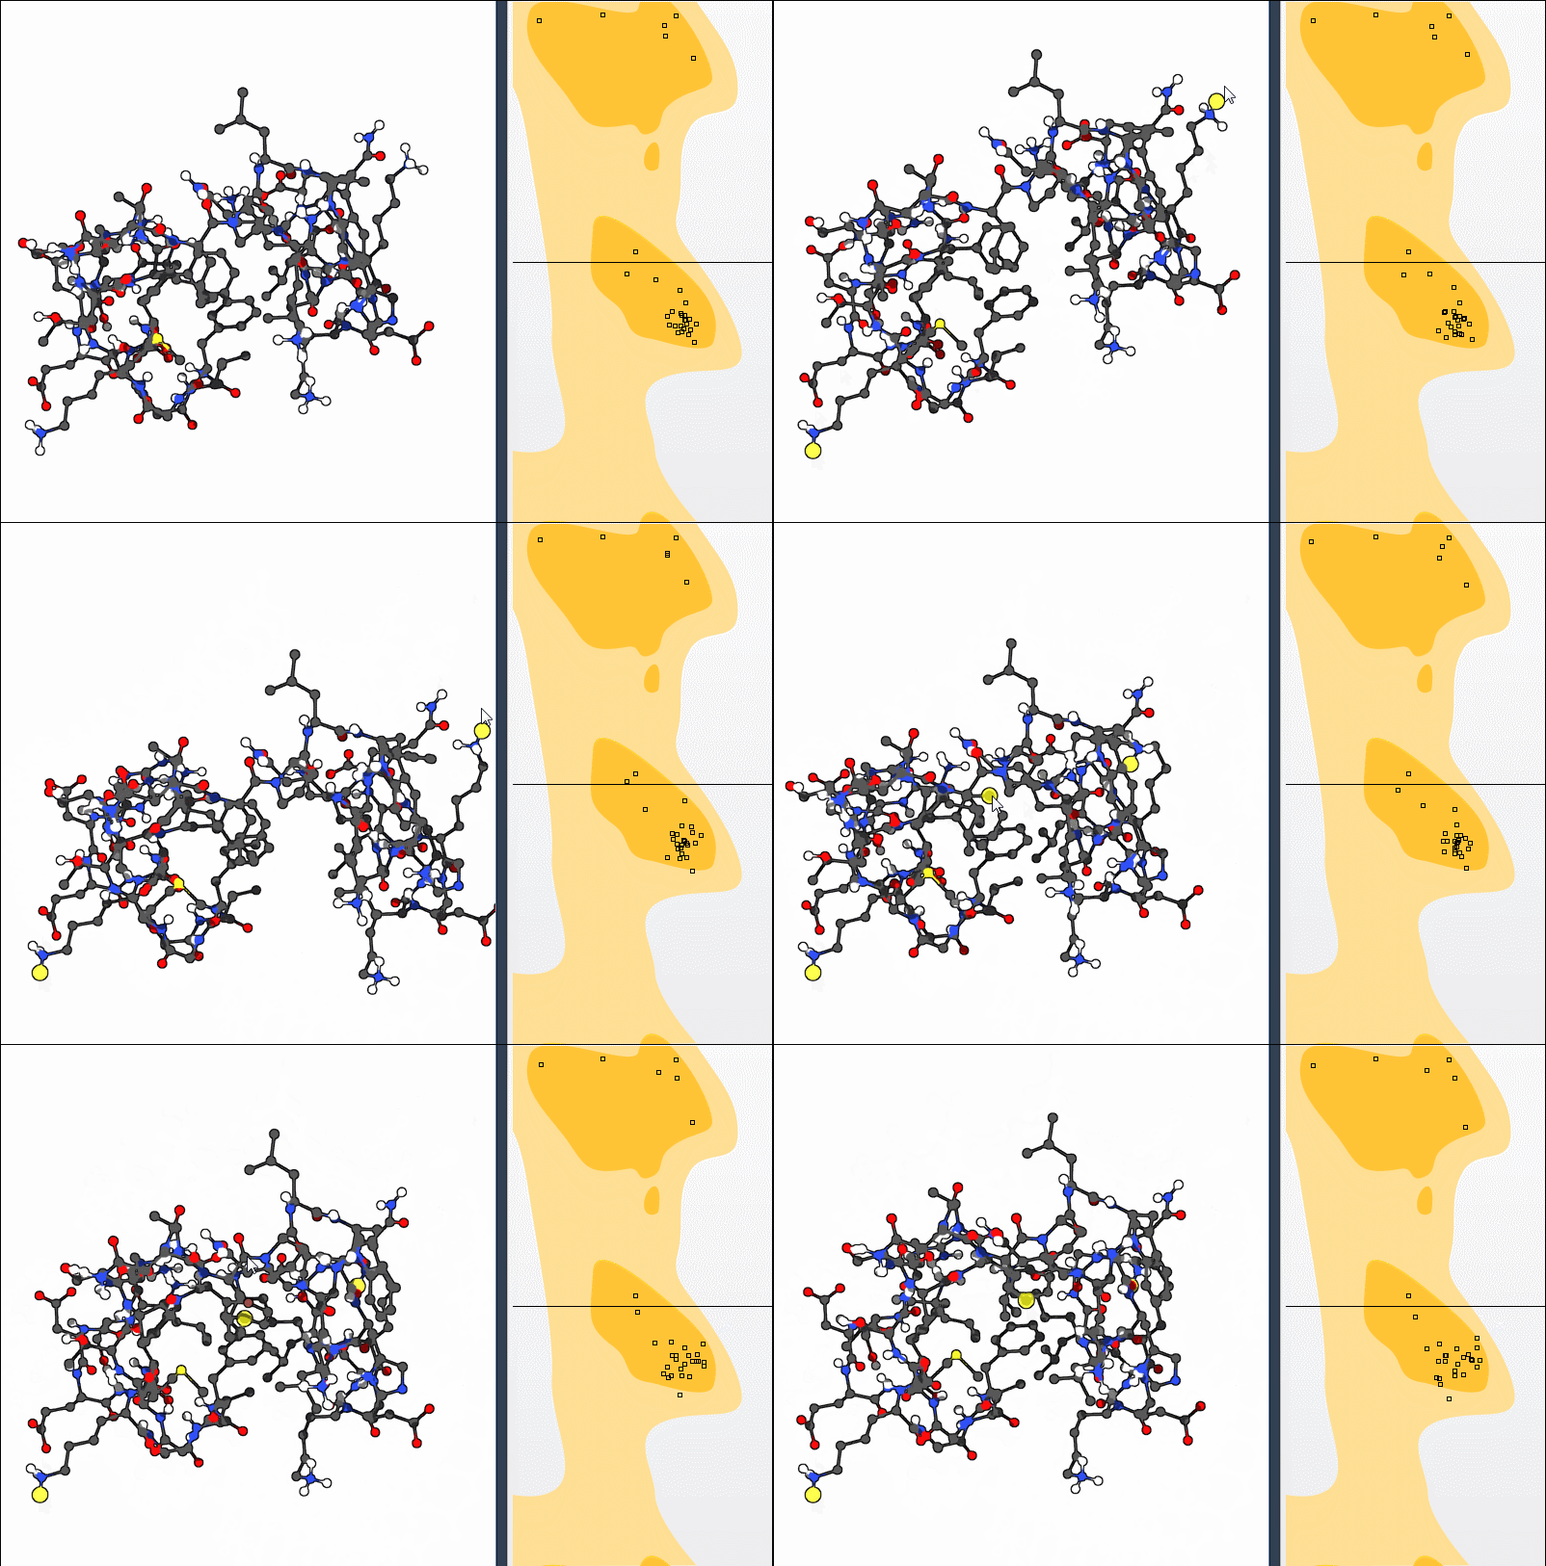
This dual capability (graph-based and structure-based editing) gives you maximum flexibility to work according to your modeling style.
Why this Matters for Molecular Modelers
By using the Interactive Ramachandran Plot app, you can:
- Quickly detect strained residues that could destabilize simulations.
- Smoothly refine homology models by correcting dihedral outliers.
- Explore flexibility around active or binding sites to assess potential conformational changes.
This tool ensures your protein structure is well-prepped for downstream workflows like docking, molecular dynamics, or drug design.
To explore these features further, visit the official documentation page: Interactive Ramachandran Plot tutorial.
Note: SAMSON and all SAMSON Extensions are free for non-commercial use. Build your molecular modeling projects today by downloading SAMSON at SAMSON Connect.