


When working on protein modeling, one of the key challenges molecular modelers face is identifying and addressing residues with unfavorable backbone conformations. Such residues can compromise the validity of simulations, docking studies, or homology modeling outputs, making thorough refinement a vital step in your workflow. The Interactive Ramachandran Plot extension in SAMSON provides an elegant, hands-on solution for inspecting and editing protein backbone dihedral angles directly from a visual φ (phi) and ψ (psi) plot.
Why Use the Ramachandran Plot?
The Ramachandran Plot is an invaluable visualization tool that maps allowed regions for backbone dihedral angles (φ vs. ψ) in amino acid residues. By highlighting energetically favorable and unfavorable conformations, it helps detect strained residues and validate your model before performing simulations or further structural refinement.
Using the Interactive Ramachandran Plot in SAMSON, you can go one step further by directly editing protein backbone angles to ensure all residues fall in favorable regions, thereby improving your protein model’s reliability.
Getting Started
Before diving in, ensure you’ve installed the Interactive Ramachandran Plot SAMSON Extension from SAMSON Connect. Once added and SAMSON is restarted, open a protein structure to update the plot in real-time.
Here’s an example workflow based on PDB structure 1YRF:
- Open Home > Fetch in SAMSON.
- Enter
1YRFunder PDB or PDB (mmCIF). - Click the Load button to fetch and load the structure.
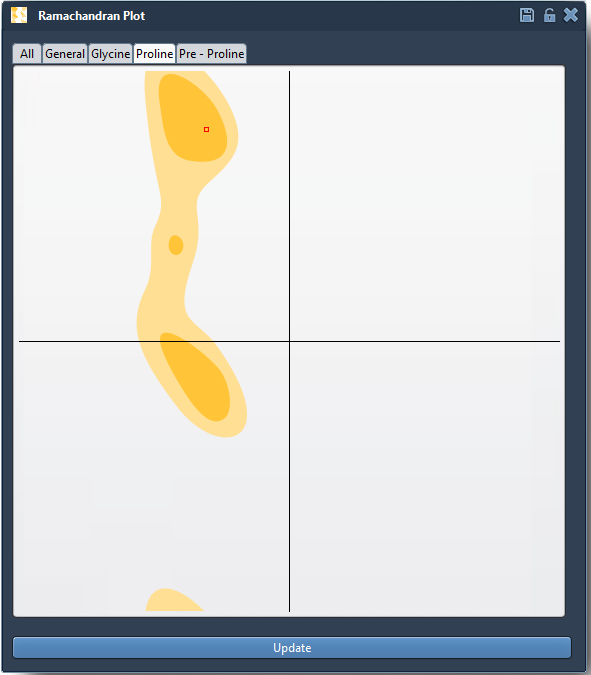
Next, access the Ramachandran Plot app by navigating to Home > Apps > Biology > Ramachandran plot. Press Update in the app interface to generate the plot for the loaded protein structure.
Unveiling Residue-Level Insights
The plot visually maps your protein’s residues based on their φ and ψ angles:
- Yellow regions signify energetically favorable conformations.
- White regions indicate unfavorable conformations to avoid.
Clicking on any point in the plot (e.g., a glycine or proline residue) automatically:
- Selects the residue in the 3D structure viewport for visual inspection.
- Displays its current dihedral angles in the status bar, helping you better understand the residue’s local environment.
Interactive Backbone Editing
What sets the SAMSON Interactive Ramachandran Plot apart is the ability to directly edit residue conformations from the plot, in two simple ways:
Option 1: Dragging Points on the Plot
- Select a residue to activate its corresponding point on the plot.
- Drag the point across the plot to dynamically update φ and ψ angles.
- Observe how the protein’s 3D structure updates interactively.
- Undo changes anytime with Ctrl/Cmd + Z.
Option 2: Twisting Residues in 3D with Twister
If you prefer working in 3D space, use the Twister editor to twist selected residues:
- Select the Twister editor from the left-hand viewport menu.
- Manipulate the dihedral angles directly in 3D, with real-time updates to the Ramachandran plot.
Conclusion
The SAMSON Interactive Ramachandran Plot makes it easy to identify and correct problematic residues, ensuring your protein model is energetically optimized and ready for advanced workflows like simulation or docking. To learn more about this powerful extension, visit the official documentation here.
SAMSON and all SAMSON Extensions are free for non-commercial use. You can download SAMSON at https://www.samson-connect.net.