



Molecular modelers often need to analyze energy changes in their systems to better understand molecular trajectories, binding paths, or reaction mechanisms. Such analyses can quickly become cumbersome if switching between different views, units, or components requires additional computation or reconfiguration. This is where SAMSON’s Energy analysis in the Path Analyzer comes in handy, providing a flexible and streamlined way to assess energy along molecular paths.
The Versatility of Energy Cards
SAMSON allows you to analyze the energy of molecular paths in a way that prioritizes flexibility and efficiency. After adding an energy card to your Path Analyzer, you can easily switch between:
- Components: Choose to focus on
Potential,Kinetic,Total, or even inspect all available energy components withAll energies. - Views: Need to compare relative energy differences? You can switch between
Absolute,Relative to first,Relative to minimum, orRunning minimumviews instantly. These options are designed to help you focus on what matters most for your specific analysis. - Units: Whether you’re working in
eV,kJ/mol,kcal/mol,Hartree, or want SAMSON to adjust automatically, the card supports all these units with an effortless switch.
This means you don’t need to rebuild your analysis or recalculate to gain deeper insights based on a different perspective. The intuitive visualization of energy data helps you capture critical trends and patterns without interruption.
Why Modifiers Like Relative Views Matter
In many scenarios, absolute energy values are not as informative as energy differences. For example, when studying conformational variability or reaction pathways, the relative energy between states provides better insight. Here is how the Relative to first and Relative to minimum views help:
Relative to first: Focuses on changes starting from the first energy point of the path.Relative to minimum: Enables you to explore energy dynamics relative to the lowest energy sampled during the analysis.Running minimum: This unique view tracks the minimum energy up to any given point, making it easier to detect stabilization or disruptions over time.
Energy Analysis Paired with Visuals
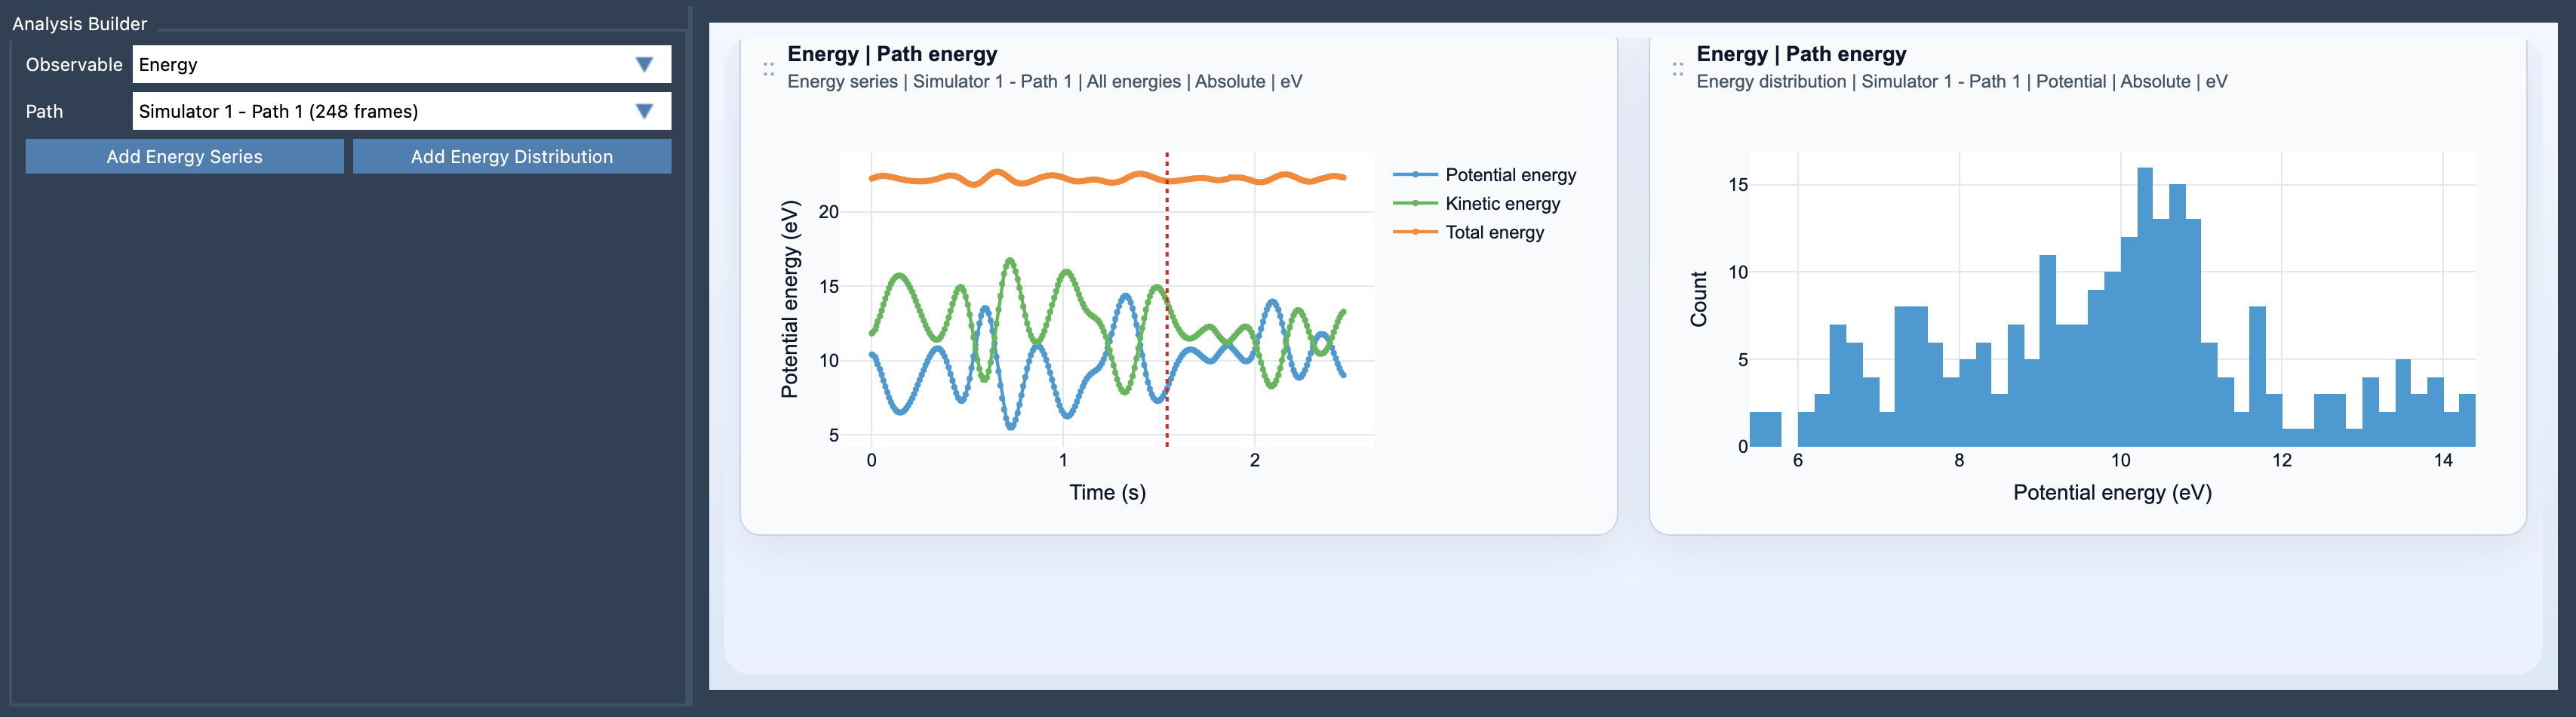
The Energy analysis also benefits from rich visuals. As you enable energy series or distributions, it becomes easier to pinpoint the exact regions or moments in pathways where significant energy variations occur. Below is an example of a Path Analyzer Energy visualization:
Tips for Better Results
To make the most of the Energy analysis, consider these tips:
- Use relative views to emphasize energy differences, which are often more meaningful than raw energy values.
- If kinetic energy data are unavailable, the Path Analyzer automatically uses potential energy, ensuring uninterrupted analysis.
- Combine energy cards with features like Custom scatter plots or Energy landscape maps for even more detailed insights.
Not only does this functionality reduce manual effort, but it also opens doors to more iterative and interactive inquiry, saving valuable time and improving research productivity.
To dive deeper into energy analysis and learn about all its capabilities, visit the full documentation page here.
SAMSON and all SAMSON Extensions are free for non-commercial use. Ready to explore molecular design with SAMSON? Get it now at https://www.samson-connect.net.