


One of the common challenges for molecular modelers is understanding how molecular components move during simulations. Whether you’re tracking a ligand unbinding from its binding pocket or studying large conformational transitions in proteins, getting a clear view of motion across time and space is crucial.
A helpful approach available in SAMSON is visualizing the trajectory of the center of mass (COM) of selected atoms along a precomputed path. This is made possible using the Pathlines Visual Model, which provides a concise, visual representation of how a molecular fragment or group migrates within a system.
What Are COM Pathlines?
Instead of showing the position of individual atoms over time, COM pathlines trace the motion of the average position of an atomic group. This representation can help you:
- Capture the dominant motion of mobile components.
- Compare alternative paths of a ligand in or out of a protein.
- Highlight directional preferences in molecular displacements.
When Is This Useful?
If you’re exploring ligand unbinding simulations, pathways from enhanced sampling methods, or domain movements in large assemblies, COM pathlines offer a cleaner and more interpretable visualization than superimposing full molecular frames over time.
How to Visualize a COM Pathline in SAMSON
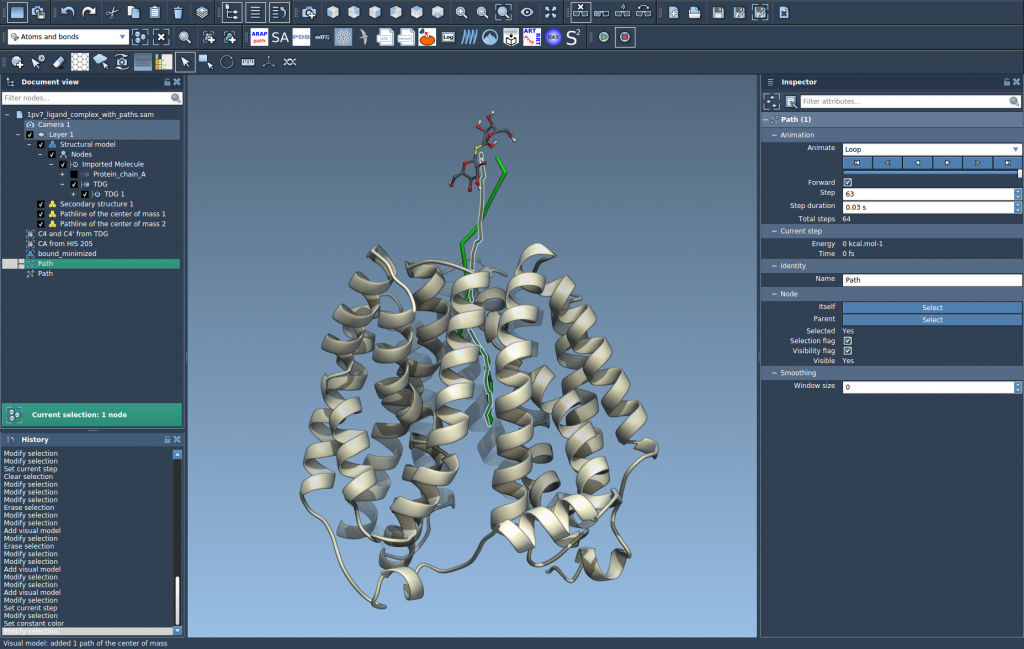
Here’s a guided example using lactose permease (PDB: 1PV7) and its ligand TDG:
- Load the sample document from SAMSON Connect. Use this link:
https://www.samson-connect.net/documents/046f1acd-c799-40f6-8185-cb4847eff795 - Select a group of atoms — for instance, the ligand or a protein domain — in the Document view.
- Hold Ctrl (or Cmd on Mac) to also select one or several calculated paths.
- Go to Visualization > Visual model > More…, or press Ctrl+Shift+V.
- Choose Pathline of the center of mass.
SAMSON will now display a line showing the motion of the group’s center of mass along the selected path(s), providing a visual overview from entry to exit.

You can further customize the pathline:
- Adjust thickness or color in the Inspector panel.
- Double-click a path to start/stop animation.
- Use the context menu to manage or delete paths.
In the example case, you can compare two unbinding paths of TDG from the protein interior to the solvent, and analyze how their COM trajectories differ spatially.
Why COM Pathlines Matter
Modelers often face the challenge of interpreting dense trajectory data. Frames upon frames of atomistic coordinates can obscure the key trends. COM pathlines reduce this complexity by summarizing motion in a single line. This makes it easier to spot bottlenecks, identify deviations between paths, or intuitively explain movement patterns to collaborators.
To learn more or explore the full tutorial, visit the Pathlines documentation page.
SAMSON and all SAMSON Extensions are free for non-commercial use. You can get SAMSON at https://www.samson-connect.net.