


When working with molecular dynamics simulations, one common challenge is efficiently interpreting the spatial motion of critical molecular components like ligands. Particularly during processes like ligand unbinding, domain shifts, or diffusion, it’s easy to get lost in a sea of atoms. A solution? Following the center of mass (COM).
The Pathlines Extension in SAMSON makes it possible to track and visualize the motion of a selected group of atoms along a predefined path. This is especially insightful for understanding molecular mechanisms at a glance, without dealing with noisy atomic displacements.
Why Follow the Center of Mass
The COM trajectory is a smoothed representation that reflects the aggregate motion of a group of atoms. This is practical for:
- Tracking ligands as they bind or unbind from a protein pocket.
- Analyzing collective domain movements within macromolecular assemblies.
- Understanding overall conformational shifts in simulations involving long trajectories.
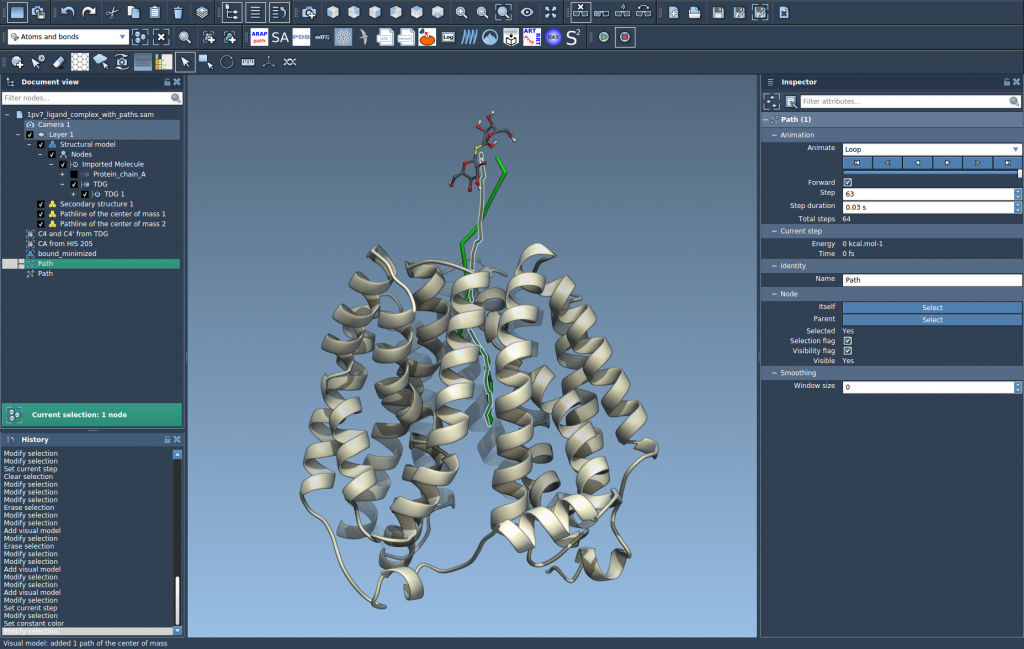
Step-by-Step: Visualizing Ligand COM Paths
Here’s how to build a COM pathline using the Pathlines Extension in SAMSON:
1. Load the Sample System
A ready-to-use sample system is available that includes the lactose permease protein in complex with the TDG ligand. It also contains pre-generated unbinding paths created with the Ligand Path Finder Extension.

The sample system features a structural model from PDB entry 1PV7. Load this into SAMSON to follow along and explore ligand trajectories.
2. Select the Ligand and Path
In the Document View, select the ligand (TDG) and optionally one or more paths. Hold Ctrl (or Cmd on Mac) to select multiple nodes.
If no selection is made, the entire system and all paths will be used by default.

3. Create the Pathline Visual Model
Go to Visualization > Visual model > More… or use the shortcut Ctrl/Cmd + Shift + V. In the dialog, select Pathline of the center of mass.

This immediately displays a smooth trajectory line representing how the ligand’s COM travels through space.
4. Customize and Explore
Double-click a path in Document View to animate it. Right-click to access further options. For deeper control, open the Inspector (Ctrl/Cmd + 2), where you can:
- Adjust line color for better contrast against your structure.
- Tweak thickness for presentation or clarity.

When This Becomes Especially Useful
Protein-ligand interactions aren’t always linear. Tracking COM is helpful when analyzing:
- Complex exit tunnels, like those found in membrane transporters or buried active sites.
- Unbinding and rebinding kinetics, visualized over multiple experimental or simulated paths.
- Simulated conformational transitions across ensembles or replica simulations.
By focusing on COM rather than individual atomic movement, you reduce clutter and expose meaningful motion.
To explore the full functionality, visit the original Pathlines documentation page.
Note: SAMSON and all SAMSON Extensions are free for non-commercial use. You can get SAMSON at https://www.samson-connect.net.