


Following atomistic motion across time can be a challenge when working with molecular simulations. Whether you’re analyzing ligand unbinding, protein domain rearrangements, or complex diffusion mechanisms, identifying meaningful trends in a cloud of atom positions is not always straightforward.
If your goal is to monitor how a group of atoms moves along a specific path — for instance, to follow a ligand escaping a binding pocket — then visualizing the center of mass (COM) trajectory with Pathlines in SAMSON can be a highly effective solution. This post walks through the creation of a COM pathline visual model, and why it’s useful.
Why Use Center of Mass Pathlines?
Instead of plotting the individual atom trajectories, the Pathlines visual model in SAMSON allows you to track the overall motion of a group of atoms by tracing the path of their center of mass along user-defined paths. This is particularly helpful in these scenarios:
- Following the unbinding or rebinding of ligands from proteins
- Analyzing the collective domain motion in large biomolecular complexes
- Observing the trajectory of molecular groups in transition path calculations
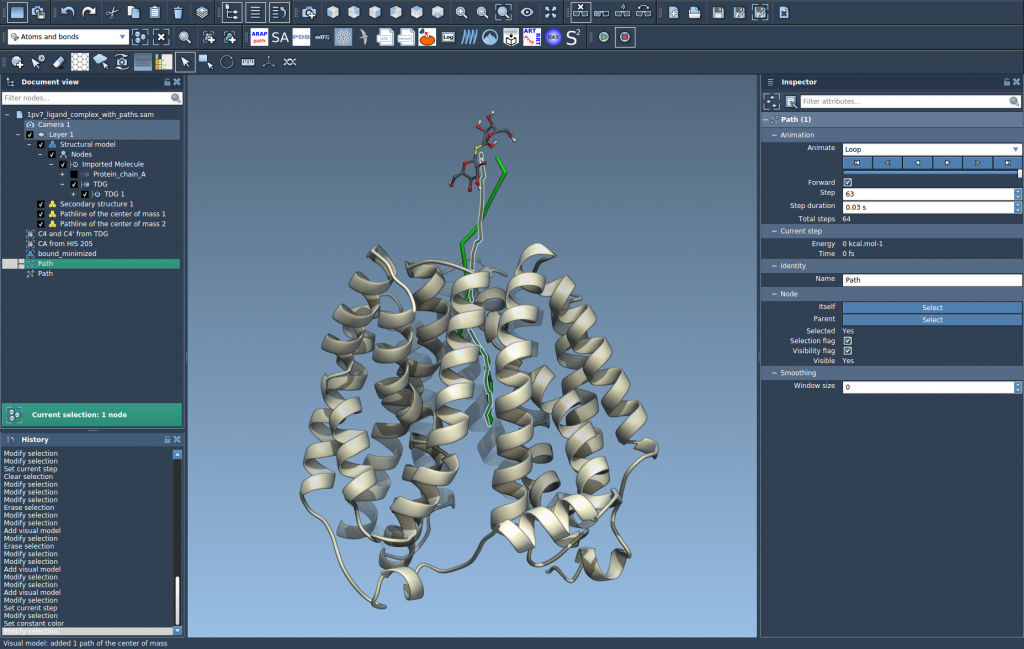
Create a Pathline: Step-by-Step
Let’s say you have a simulation where a ligand detaches from a protein. You can use SAMSON’s Pathlines Extension to trace the trajectory of the ligand’s COM as it exits.
Here’s how:
1. Select Atoms and Paths
In the Document View, select a group of atoms (e.g., the ligand) and one or more paths that represent motion (such as ones generated by the Ligand Path Finder). To select multiple items, hold Ctrl (or Cmd on Mac).
If nothing is selected, SAMSON will default to applying all available atoms and paths.

2. Create the Visual Model
- Go to Visualization > Visual model > More…
- In the dialog, choose Pathline of the center of mass and confirm
This tells SAMSON to compute the center of mass of the selected atoms and trace its progression along the path.

3. Observe and Customize
Once added, the pathline will appear in the scene, showing the COM displacement visually. You can:
- Adjust color and thickness using the Inspector (Ctrl/Cmd + 2)
- Double-click a path to animate or stop it
- Access path options via right-click in the Document View

Common Use Cases
- Display clear representations of ligand exit routes
- Track center-of-mass migration during pathway optimization
- Highlight displacement during domain movement studies
By extracting and visualizing just the COM motion, researchers can highlight the most essential aspects of molecular travel, cutting through the visual clutter of full-atom trajectories.
To learn more, visit the Pathlines documentation page.
SAMSON and all SAMSON Extensions are free for non-commercial use. To explore Pathlines and more, download SAMSON here.