



For molecular modelers, understanding how protein structures change over time is crucial. Whether you’re monitoring an alpha-helix unraveling under stress or identifying structural shifts in a loop region, you need a reliable way to track secondary structure transitions at a glance. This is where the Secondary Structure Content tool in SAMSON’s Path Analyzer becomes indispensable.
What Does Secondary Structure Content Offer?
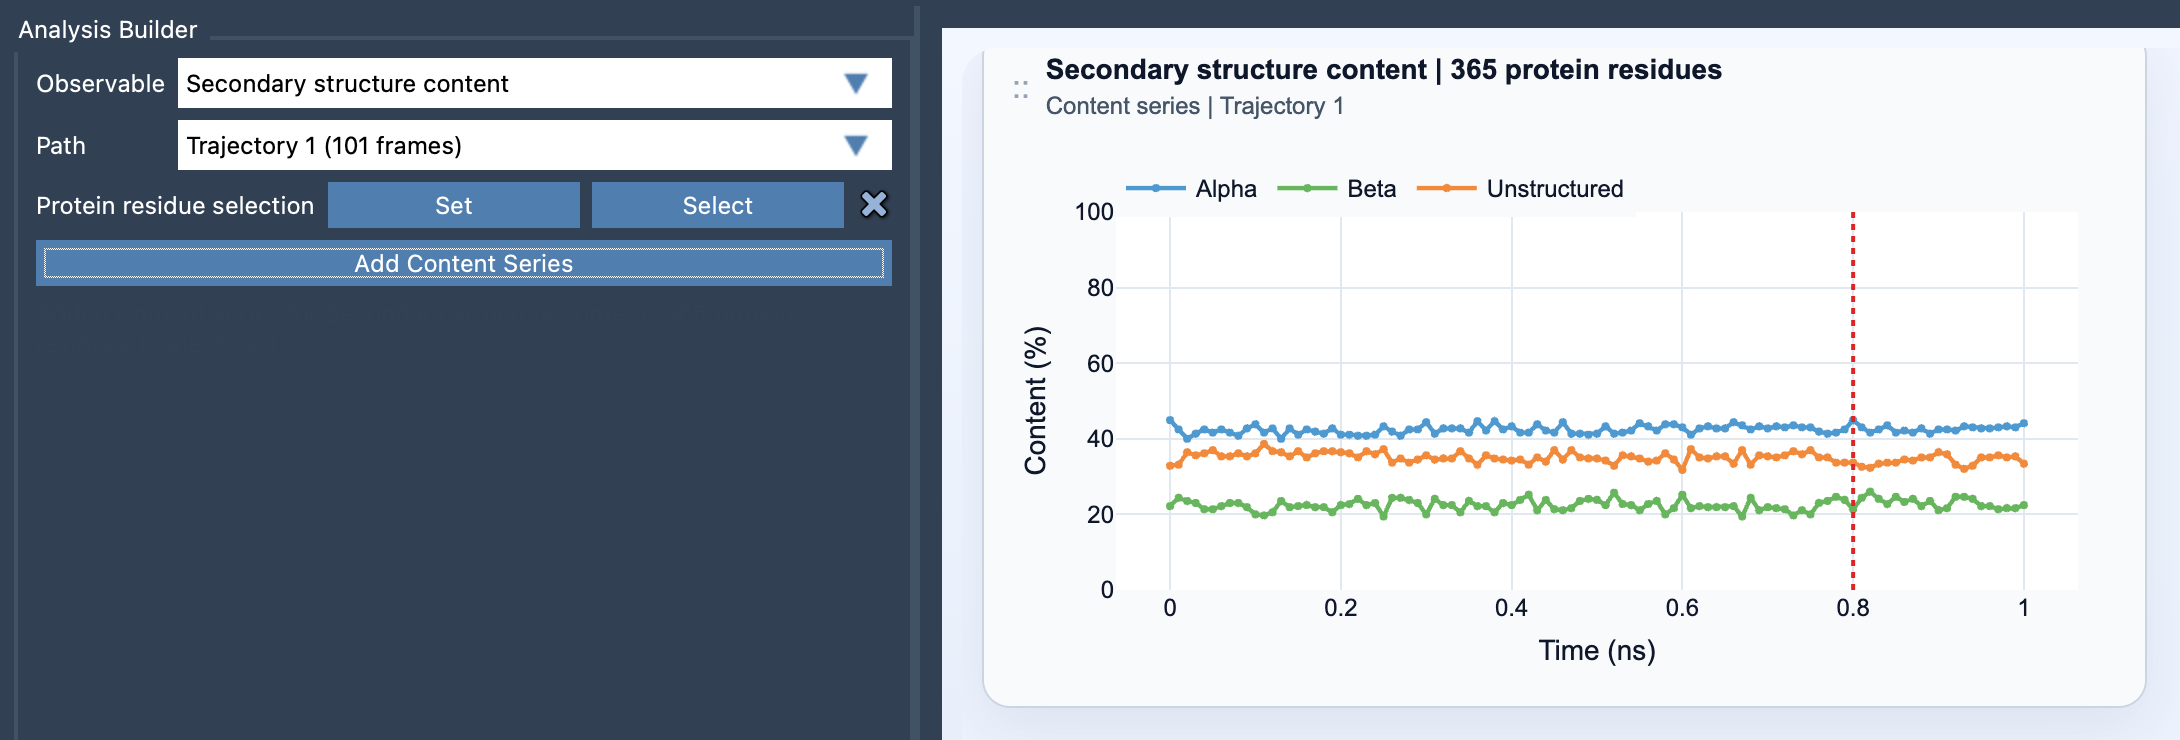
The Secondary Structure Content tool provides an overview of how much of your selected protein region is in an alpha-helix, beta-sheet, or unstructured state across frames in your simulation. Instead of analyzing each residue individually, you get a streamlined, high-level summary of backbone changes over time. This makes it especially useful for spotting trends in protein conformation at a glance.
Setting It Up
It’s straightforward to use:
- Open the Path Analyzer.
- In the Observable menu, select Secondary structure content.
- Choose a Path that represents your molecular trajectory.
- Specify a Protein residue selection depending on what part of the protein you want to analyze (e.g., the whole protein, a domain, or a loop).
- Click Add Content Series to visualize the breakdown of alpha-helix, beta-sheet, and unstructured content as percentages over time.
That’s it. The tool computes the secondary structure dynamically and presents results in an intuitive multi-series time plot with values between 0 and 100%.
When and Why to Use Focused Selections
This tool can dynamically adapt depending on your selection:
- If you’re studying a specific functionally important domain of the protein, a focused selection ensures you don’t dilute region-specific changes by including unrelated parts of the molecule.
- For broader cases, such as exploring an overall protein stability, choose a global selection to capture system-wide trends.
Pairing this with the Ramachandran tool provides both an aggregated and detailed view. The Secondary Structure Content plots the broader trends, while the Ramachandran tool delves into residue-level details of backbone dihedral angles.
How Does It Work?
The tool computes the percentage of alpha, beta, or unstructured residues in the current selection for each frame. Mathematically, it can be expressed as:
For instance, the percentage of alpha-helical residues (%α) at a given frame t is calculated as:
|
1 |
%α(t) = 100 * N<sub>α</sub>(t) / N<sub>res</sub> |
Where Nα(t) is the number of alpha residues at frame t, and Nres is the total number of residues in the selected region.
This calculation is repeated for beta and unstructured residues, allowing you to observe how a protein’s structural composition evolves over time in your trajectory.
Key Tips for Effective Analysis
- Use broad selections for an overall protein-wide view of secondary structure evolution.
- Focus selections on specific areas (such as helix bundles or loop-rich regions) to study localized phenomena in greater detail.
- Combine this tool with molecular visualization techniques in SAMSON to precisely link the changes in the chart to structural changes in 3D.
Conclusion
The Secondary Structure Content tool provides a fast and efficient way to monitor backbone shifts, offering insights into protein stability, folding events, or structural changes in different environments. It simplifies the complexity of secondary structure analysis without losing critical information, enabling you to focus on the questions that matter most in your research.
To dive deeper, explore the full documentation of the Secondary Structure Content feature at this link.
SAMSON and all SAMSON Extensions are free for non-commercial use. Start exploring molecular design with SAMSON by downloading it at samson-connect.net.