Following atomic motion during a simulation can reveal a great deal about molecular mechanisms, such as how a ligand unbinds from a protein or how internal domains move collectively. Yet, for molecular modelers, focusing on individual atom trajectories can be overwhelming—what really matters is where the system as a whole is going. One way to simplify and enhance the analysis is by visualizing the path of the center of mass (COM) of selected atom groups. With this approach, you can answer key questions about molecular motion—without getting lost in a sea of atomic coordinates.
SAMSON’s Pathlines Extension provides a way to do just that. It helps you visualize how the COM of a group of atoms moves along specified paths. Whether you’re studying ligand unbinding routes, protein domain transitions, or general diffusional behavior, this tool offers a more intuitive picture of motion through space and time.
Why focus on the center of mass?
Many molecular events involve collective movement rather than individual atom motion. Tracking the COM of a ligand or a domain can highlight where and how that structural unit is traveling, simplify data interpretation, and give insight into mechanism.
- Ligand binding/unbinding: Visualize the entire motion of a ligand across a simulated unbinding path.
- Domain shifts: Analyze large-scale internal rearrangements in multi-domain proteins or complexes.
- Diffusion studies: See how molecules migrate through environments, such as membrane channels.
Three steps to create a Pathline from COM
Step 1 — Select atoms and paths
To create a meaningful center-of-mass trajectory, select the atoms you’re interested in—for example, all atoms in a ligand—and the path(s) the system follows. If you don’t select atoms, the entire system is used. The same goes for paths: if none are selected, the extension uses all paths present.

Step 2 — Create a Pathline visual model
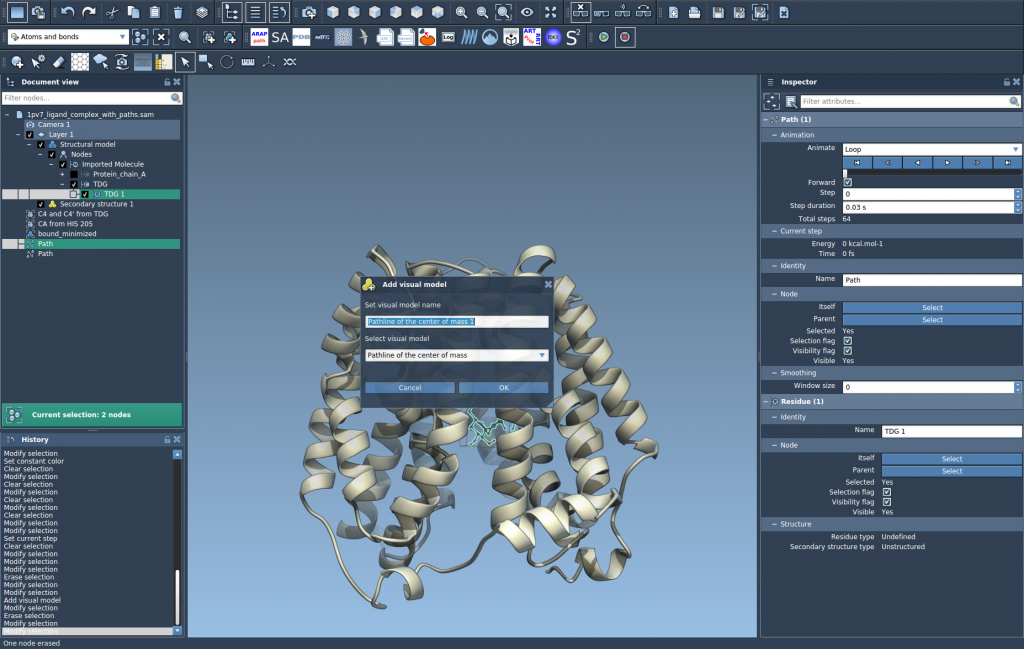
Once your selections are made, go to Visualization > Visual model > More…. In the dialog that appears, choose Pathline of the center of mass and click OK. This generates a visual representation of how the COM of the selected atoms moves along the path(s).

Step 3 — Customize and analyze
You can explore and customize the model to better fit your analysis. For example:
- Double-click paths to play animations of the motion.
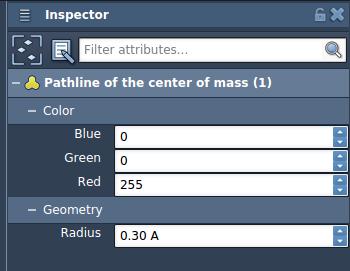
- Use the Inspector to change visuals like thickness or color.
- Inspect the pathline closely to see how the group transitions over time.

A sample in action
One illustration is the movement of a ligand (TDG) during unbinding from Lactose permease (1PV7). You can visualize the ligand’s COM across pre-defined unbinding paths generated by SAMSON’s Ligand Path Finder. This visual snapshot helps differentiate alternate egress routes or motion patterns under different conditions.
Final thoughts
Center-of-mass pathlines are a compact, intuitive way to represent motion across atomistic simulations. They simplify analysis, improve clarity, and can uncover unexpected routes or behaviors. Whether used for presentations or deeper mechanistic studies, they provide a high-value visual summary of molecular motion.
Learn more in the full documentation page: https://documentation.samson-connect.net/tutorials/pathlines/pathlines/
SAMSON and all SAMSON Extensions are free for non-commercial use. You can get SAMSON at https://www.samson-connect.net.


