



Molecular modelers working on complex systems often face the challenge of collecting and making sense of simulation data for deriving the Potential of Mean Force (PMF). Converting raw data into a PMF profile provides valuable insights into the energy landscape of a reaction coordinate. However, for many researchers, this step can be intimidating, involving intricate workflows and data analysis. Thankfully, the GROMACS Wizard within SAMSON simplifies PMF analysis using the Weighted Histogram Analysis Method (WHAM).
From Simulation Data to PMF Clarity
The PMF profile generation process provided by GROMACS Wizard integrates seamlessly with umbrella sampling simulations. Here’s a quick overview of how it works, why it helps solve common pain points, and how you can implement it yourself.
PMF analysis comes after completing an umbrella sampling workflow, where simulation data across multiple windows of a reaction coordinate is collected. What makes PMF analysis daunting for many practitioners is ensuring proper organization, input data accuracy, and effective processing. GROMACS Wizard addresses this by automating critical steps and organizing results.
Step-by-Step Guide: Generating Your PMF Profile
To begin, switch to the WHAM Analysis tab in the GROMACS Wizard interface. Here’s a simplified guide to navigating the process:
- Set the Project Path: Choose your project directory containing the umbrella sampling results, or use the auto-fill button (
 ) to populate the path if you’ve just completed the previous step within GROMACS Wizard.
 - Confirm Folder Organization: Ensure that your input folder has numbered subfolders, each corresponding to a specific umbrella sampling window. Properly labeled subfolders simplify importing the reaction-coordinate setup and related parameters automatically.
- Select Reaction Coordinate: Choose a specific reaction coordinate from the automatically loaded data in your project.
- Adjust Settings: If needed, refine optional parameters such as bounds, time ranges, or energy units to fit your analysis needs.
- Compute the PMF: Click the ‘Compute’ button, and GROMACS Wizard will take care of processing your data.
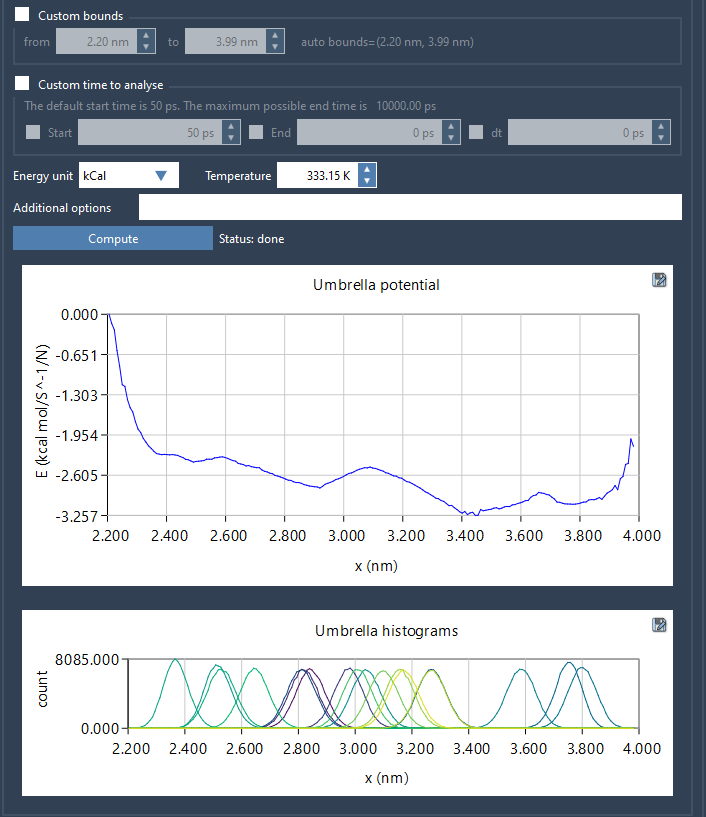
During the computation, the tool generates two essential plots:
- The PMF profile showcasing the energy landscape over the reaction coordinate.
- A histogram indicating the coverage of the reaction coordinate space, which helps diagnose insufficient sampling within specific regions.
Why This Matters
One frequent pain point is spotting gaps in sampling coverage or wondering whether additional simulations are needed to improve results. With the automatically generated histogram, GROMACS Wizard makes it easy to identify areas where sampling is insufficient. This visual cue can save countless hours otherwise spent on trial-and-error approaches.
Moreover, the PMF profile itself is essential for understanding molecular interactions, guiding both research and practical applications like drug design. GROMACS Wizard’s streamlined approach to WHAM liberates researchers from the technical complexities of traditional PMF analysis software while maintaining flexibility.
Interpreting Results and Next Steps
After computation, the PMF profiles, histograms, and plots are saved in a wham_results subfolder within your project. If additional reaction coordinates are selected later, the Wizard reuses processed data for efficiency.
Studying the histogram is particularly valuable for identifying under-sampled regions. If gaps are found, you can revisit the Umbrella Sampling workflow within GROMACS Wizard to add or extend simulations for those areas.
Learn More
Want to delve deeper into generating and interpreting PMF profiles with GROMACS Wizard? Visit the full documentation page here: GROMACS Wizard – PMF Analysis Documentation.
SAMSON and all SAMSON Extensions are free for non-commercial use. Get started today: https://www.samson-connect.net.