One of the common challenges faced by molecular modelers when performing Potential of Mean Force (PMF) calculations is preparing the input folder structure for the Weighted Histogram Analysis Method (WHAM). If you’ve tried setting everything up manually, you might have encountered obstacles like inconsistent folder names, missing files, or incompatible trajectory data. These can easily lead to incomplete or faulty PMF results, wasting hours of simulation time.
The GROMACS Wizard within the SAMSON platform provides a more streamlined solution, but understanding how to structure your project folder correctly is key. In this post, we’ll walk you through how to organize your umbrella sampling data so that GROMACS Wizard can analyze it efficiently using WHAM.
What’s the problem?
When working with umbrella sampling, modelers often generate multiple simulations along a reaction coordinate. Each simulation needs to be distinguishable and aligned precisely for WHAM to compute a smooth PMF curve. However, without clear guidance, users often mix reaction coordinates or leave files improperly named or located. The result? GROMACS Wizard doesn’t recognize your project, or even worse—it produces misleading results.
Organizing your data the right way 📂
Here’s how your umbrella sampling project folder should be structured for seamless WHAM analysis:
- Create a main project folder—this will be the one you point GROMACS Wizard to.
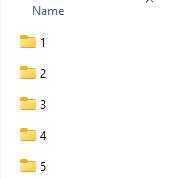
- Inside the main folder, create numbered subfolders like
001,002,003, and so on. Each one should correspond to a simulation window along your reaction coordinate. - Each subfolder needs to include the simulation outputs for that specific window—typically files like
pullf.xvg,conf.gro, andmd.tpr.
Take a look at the image below for visual guidance:

Once your folders are correctly structured, open GROMACS Wizard and switch to the WHAM Analysis tab. You can either manually select the project path or click on the auto-fill button:
![]()
After setup, what’s next?
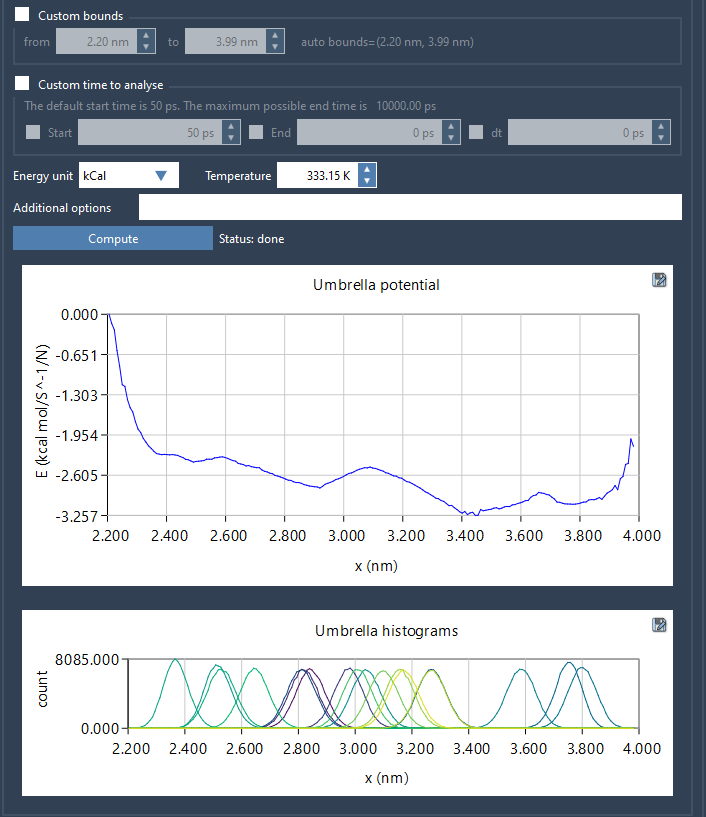
Once the Wizard recognizes the project structure and loads the necessary simulation and reaction coordinate information, you’ll be able to choose from settings like coordinate bounds, simulation time, and energy units. Click Compute to generate two vital graphs:
- PMF graph – This displays the computed free energy profile along your reaction coordinate.
- Histogram – This helps you evaluate whether your reaction coordinate space is thoroughly sampled. If it’s not, you’ll clearly see where more simulations are needed.

All results are automatically saved in a wham_results subfolder within your main project folder. This enables fast re-analysis if you switch to a different reaction coordinate or adjust parameters.
Takeaway
Correct folder organization isn’t just a matter of tidiness—it’s essential for accurate PMF calculations using WHAM. With the right setup, GROMACS Wizard can do the heavy lifting and allow you to focus on interpreting the science instead of chasing file errors.
To learn more, visit the original PMF analysis tutorial page.
SAMSON and all SAMSON Extensions are free for non-commercial use. You can download SAMSON and start building your molecular modeling workflows at https://www.samson-connect.net.


