One of the recurring challenges molecular modelers face is extracting meaningful free energy profiles from umbrella sampling simulations. The workflow becomes particularly cumbersome at the post-processing stage — especially when dealing with tens or hundreds of windows, each producing individual trajectories. Many researchers still rely on manual scripting to run the Weighted Histogram Analysis Method (WHAM), monitor convergence, re-weight histograms, and validate reaction coordinate coverage.
The GROMACS Wizard in SAMSON offers a more straightforward and visual solution to this. Its WHAM Analysis tab provides an interactive way to compute Potential of Mean Force (PMF) profiles without the need to write or debug custom scripts. This is particularly helpful when dealing with complex systems where modelers need to quickly assess whether sampling is adequate or where further simulations might be necessary.
An overview of the process
Once your umbrella sampling simulations are done (possibly generated with the GROMACS Wizard’s Batch Computation feature), your results will likely be organized into a set of numbered subfolders, each representing a specific biasing window along the reaction coordinate. These folders should contain the output trajectories for each simulation. When you switch to the WHAM Analysis tab, you can either select the appropriate project path manually or use the auto-fill feature:
![]() This icon will retrieve paths from your previous steps automatically.
This icon will retrieve paths from your previous steps automatically.
Here’s how the folder structure should look:

Automatic input detection
Once the project folder is selected, GROMACS Wizard automatically parses the simulation data and identifies:
- Reaction coordinates (names and bounds)
- Simulation time frames
- Temperature
You can then select which reaction coordinate to analyze, fine-tune parameters such as time intervals or energy units, and initiate the WHAM computation with a single click on Compute.
Understanding and reusing results
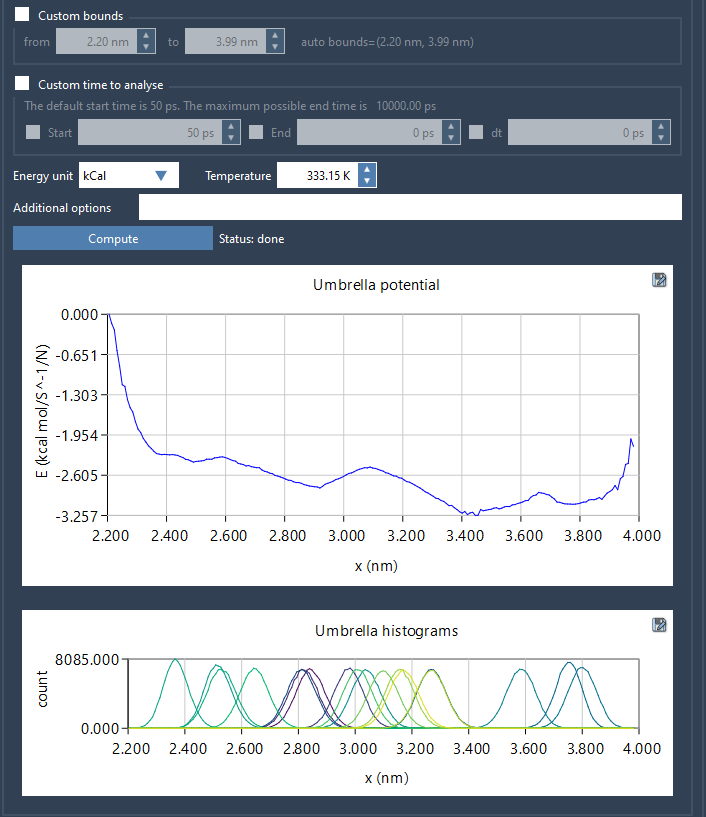
Once the computation completes, two graphs are produced:
- The PMF curve, which shows the free energy profile along the reaction coordinate
- The histogram, which visualizes the distribution of sampling across the coordinate

The histogram is especially valuable for identifying sections of the reaction coordinate that may be under-sampled. This insight can guide future simulations and help ensure proper overlap between windows — crucial for convergence of WHAM results.
Even better, all computed data — including WHAM profiles and histograms — are stored under a wham_results subfolder in your project. So, if you toggle between different reaction coordinates later, the GROMACS Wizard will use the previously computed data, saving you time and processing power.
If you regularly work with PMF computations and want to streamline your workflow, this WHAM module in SAMSON’s GROMACS Wizard could be worth exploring.
To learn more, visit the full documentation here: https://documentation.samson-connect.net/tutorials/gromacs-wizard/pmf-analysis/
SAMSON and all SAMSON Extensions are free for non-commercial use. You can download SAMSON at https://www.samson-connect.net.


