



A molecular trajectory can produce many useful measurements: distances, energies, RMSD, radius of gyration, solvent-accessible surface area, and more. But when those measurements are inspected one at a time, it can be hard to tell whether they change together—or whether an apparent change in one observable accompanies a distinct structural state.
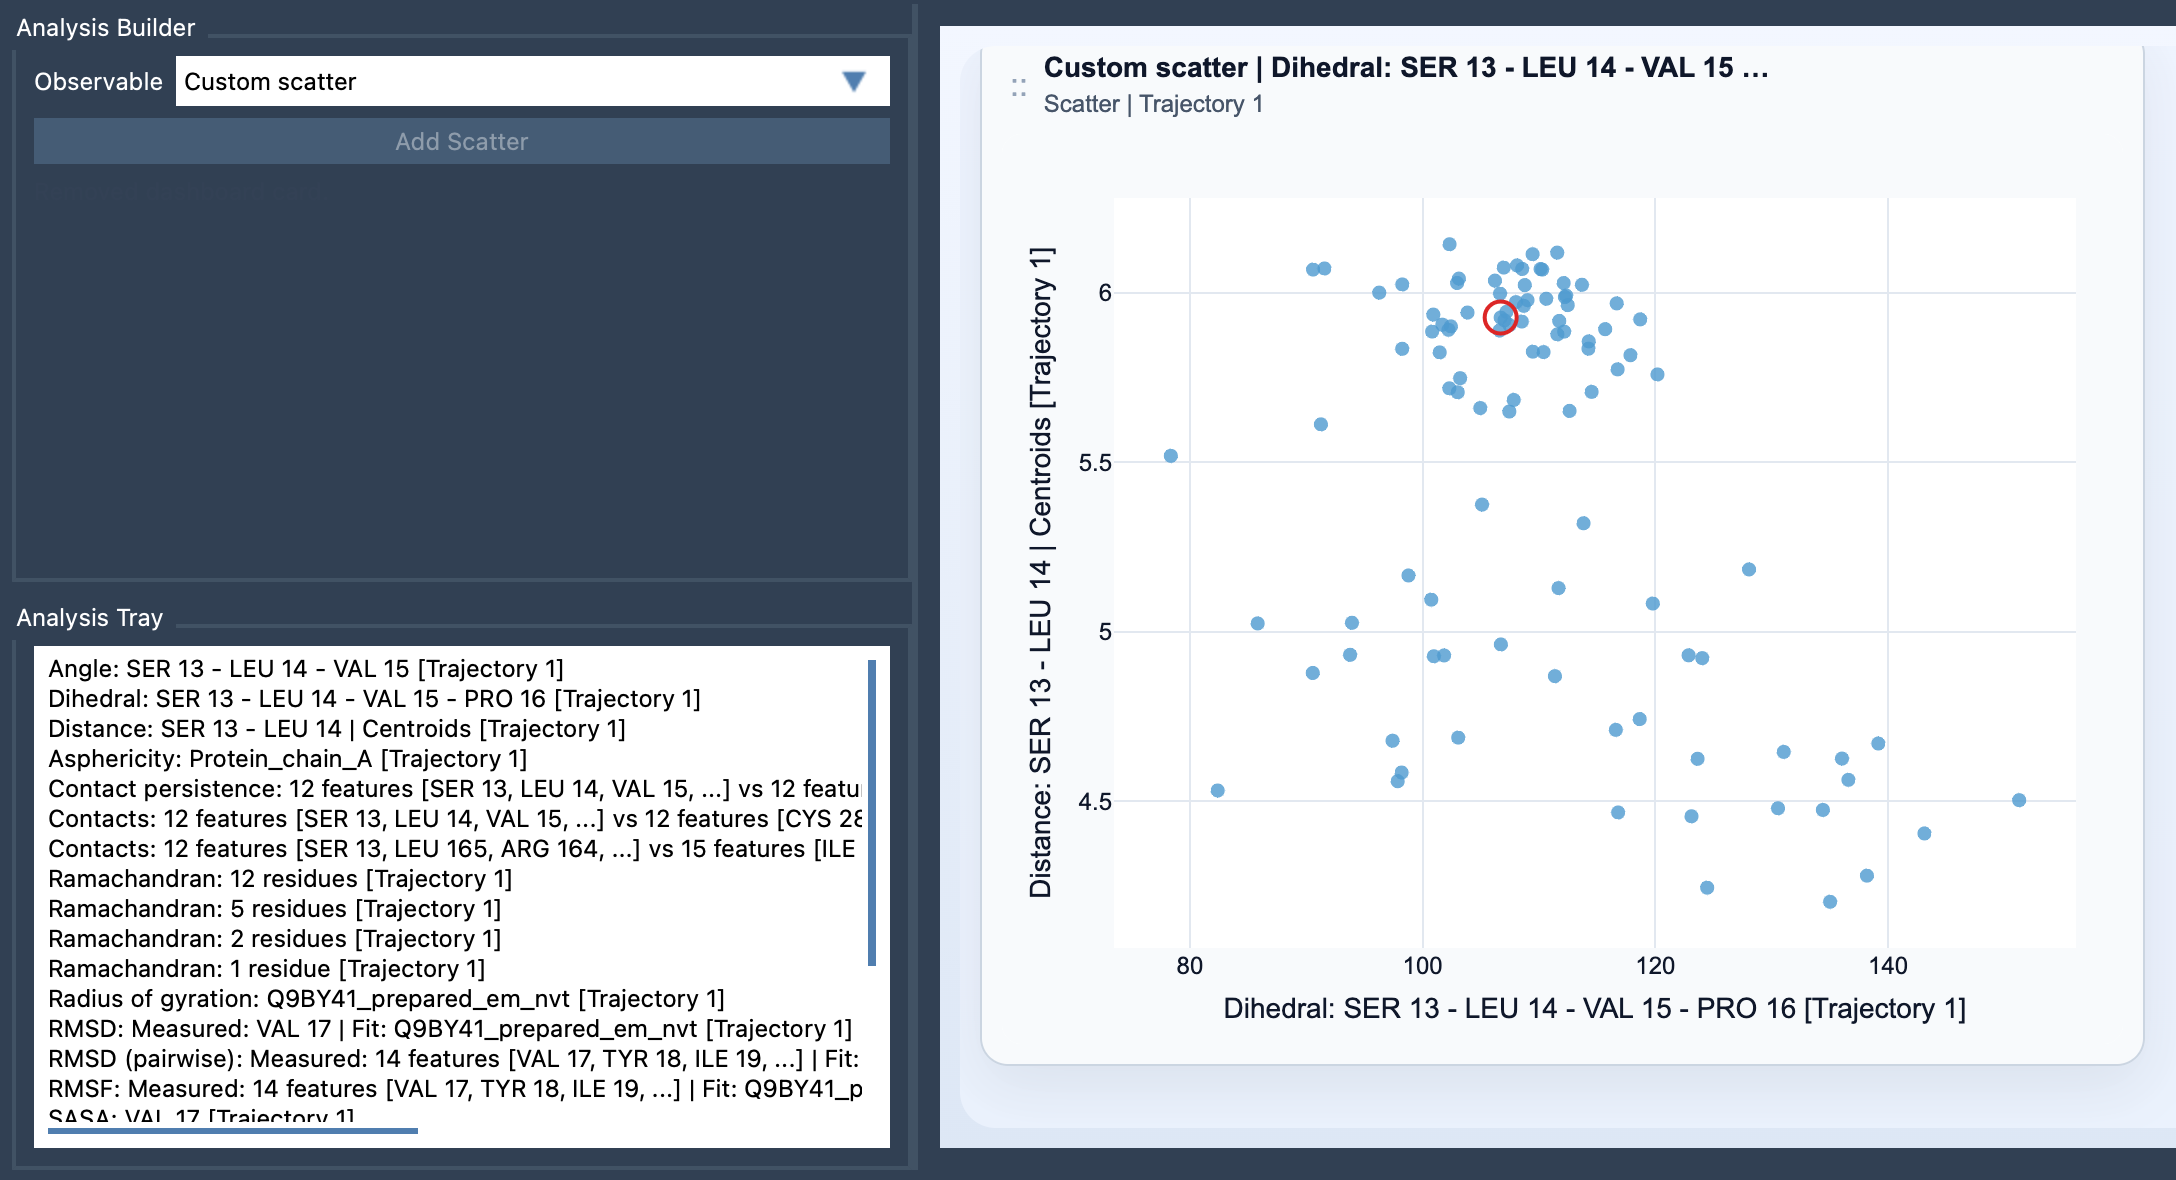
A custom scatter plot puts two saved scalar analyses into the same view. Each point represents one sampled pair of scalar values. Instead of scanning two separate results, you can look for patterns that may help answer a focused question: does a distance tend to increase as energy changes? Do configurations with similar RMSD also have similar radii of gyration? Does SASA vary alongside a particular distance?
Start with a question, not just two measurements
The most useful pair is the one that tests a scientific idea. For example, if you want to examine whether a structural change is associated with an energy change, compare Distance vs Energy. To explore whether overall structural deviation accompanies changes in compactness, try RMSD vs Radius of gyration. A SASA vs Distance comparison can help you inspect whether a distance change coincides with a change in solvent exposure.
A scatter plot is a way to explore a relationship, not proof that one observable causes another. Look for the broad shape of the points: a clear upward or downward trend can suggest that the quantities vary together or in opposite directions; separated groups can prompt you to ask whether different conformational regions or states are represented. A diffuse cloud may mean there is no simple relationship visible in this pair—or that a more specific question is needed.
Build the plot in Path Analyzer
- Open Path Analyzer.
- Create or reuse two scalar analyses in the Analysis Tray.
- Choose Custom scatter under Observable.
- Select exactly two saved scalar analyses in the tray, then click Add Scatter.
Custom scatter is a derived analysis, so it uses saved analyses from the tray rather than direct atom selections. Check that both inputs are scalar analyses before building the plot. It can be helpful to choose observables with a clear interpretation and a shared context, such as measurements from the same path, so the comparison addresses one question rather than collecting unrelated quantities.
Use the points to return to the structure
When both source analyses come from the same path and remain frame-linked, the scatter plot can stay connected to the current frame. In that situation, clicking a point can move the path to its corresponding frame. This makes the plot more than a summary: a pattern or cluster that catches your attention can lead you back to the associated molecular configuration for inspection.
Keep the interpretation grounded in what the plot shows. A cluster is a useful cue to investigate, not by itself an explanation of why those configurations differ. Likewise, a trend can guide your next analysis without establishing a mechanism. Pairing a visual pattern with inspection of the corresponding frames helps connect numerical observations to molecular structure.
What to try next
Custom scatter is often a useful first look at two observables. If the point distribution suggests regions of interest, you can explore them further with a 2D density map or an Energy landscape. For setup details, see the Custom Scatter documentation.
Note: SAMSON and all SAMSON Extensions are free for non-commercial use. Get SAMSON.