



Molecular modelers and computational scientists commonly grapple with the challenge of analyzing dynamic trajectories effectively. Whether you are identifying areas of rapid movements in a molecular system or tracking moments of relative calm, understanding velocity changes across a time-based trajectory can provide deep insights into your research. This is where the concept of Average Velocity comes into play within SAMSON’s Path Analyzer.
Why Average Velocity Matters
The Average Velocity tool is particularly useful for dynamically rich molecular simulations. It calculates the mean velocity magnitude of a selected group of atoms along a chosen path, enabling you to:
- Quickly identify significant motion events, such as bursts or lulls, within your system.
- Visualize velocity trends along trajectories to detect spatial or temporal variations.
- Compare results with related metrics, like average force, to connect driving forces to observed physical changes in the system.
In essence, this analysis enhances your ability to inspect molecular behavior with precision, without sifting through overwhelming amounts of raw data.
How to Add and Interpret an Average Velocity Plot
Getting started with the Average Velocity analysis in SAMSON is straightforward:
- Navigate to the Path Analyzer.
- Select Average Velocity from the Observable dropdown list.
- Choose a trajectory path and define the specific atomic group you wish to analyze.
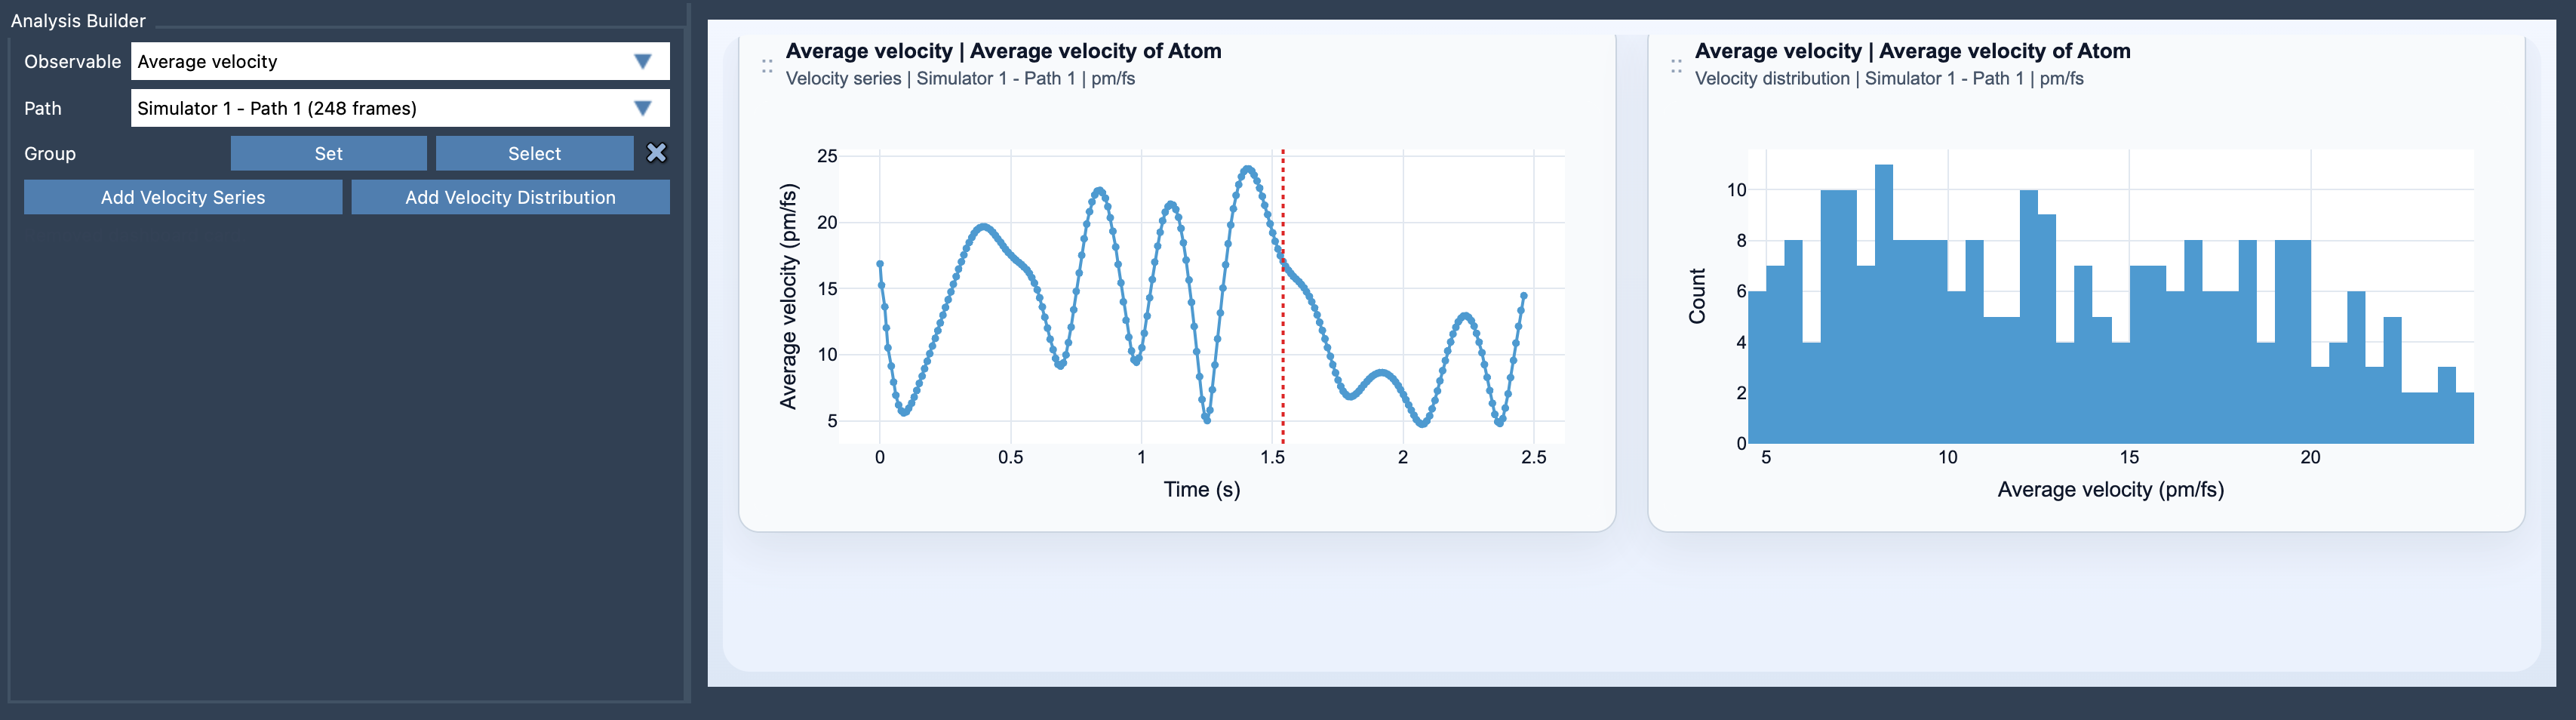
- Click Add Velocity Series to create a plot of velocity versus time, or choose Add Velocity Distribution to investigate the statistical distribution of velocities.
The resulting plot will provide two primary views:
- Velocity series: A time-dependent plot of the mean velocity magnitude to track changes along the trajectory.
- Velocity distribution: A histogram showing the distribution of sampled velocities over the trajectory.
A Practical Example
Let’s consider a scenario: you’re analyzing the conformational dynamics of a protein-ligand system. To identify whether binding events correlate with certain velocity bursts, you could:
- Define the atom groups involved in the binding interface as your selection.
- Use the Average Velocity analysis to detect whether bursts of motion occur during ligand unbinding events or if there are quieter, stabilizing moments during binding.
- Overlay your velocity analysis with an Average Force analysis (available also in SAMSON Path Analyzer) to better understand the dynamics-driving forces.
These observations can help you refine hypotheses about molecular mechanisms or dynamics.
Customizing the Analysis
The Average Velocity tool also allows customization for more tailored insights:
- You can switch between commonly used units for velocity, including
pm/fs,A/ps, andm/s, depending on the needs of your analysis. - You can focus on specific frames within the trajectory to narrow down in-depth analyses of particular regions.
With these capabilities, Average Velocity brings clarity to often intricate and nuanced molecular simulation data.
Use It Effectively
Keep these tips in mind for best results:
- Apply Average Velocity analysis only to trajectories rich in dynamical information, ensuring the results hold meaningful relevance.
- Leverage it alongside complementary analysis tools like force or displacement analyses to paint a comprehensive picture of your system.
To delve deeper into the Average Velocity tool in SAMSON, visit the official documentation page.
SAMSON and all SAMSON Extensions are free for non-commercial use. You can get SAMSON here.