



For molecular modelers, understanding the shape of molecular structures over a path or trajectory is often a critical part of their analyses. One challenge is moving beyond traditional tools like radius of gyration, which may not capture the nuances of anisotropic shapes. This is where asphericity steps in, providing a way to measure deviations from a spherical shape with clarity and precision.
Asphericity is a valuable shape descriptor used to assess how much a selected group deviates from a spherical shape along a defined path or trajectory. Instead of reducing the description to a single distance or oversimplified parameter, the asphericity analysis offers nuanced insights into shape anisotropy.
Why Use Asphericity?
While radius of gyration helps measure the overall size of a system, capturing fine details about shape can elude it. Asphericity allows you to:
- Identify anisotropic features in molecular groups.
- Analyze how the shape evolves over time or along a molecular path.
- Complement other descriptors, such as the radius of gyration and the shape parameter, for a more holistic picture of molecular geometry.
How to Add an Asphericity Plot
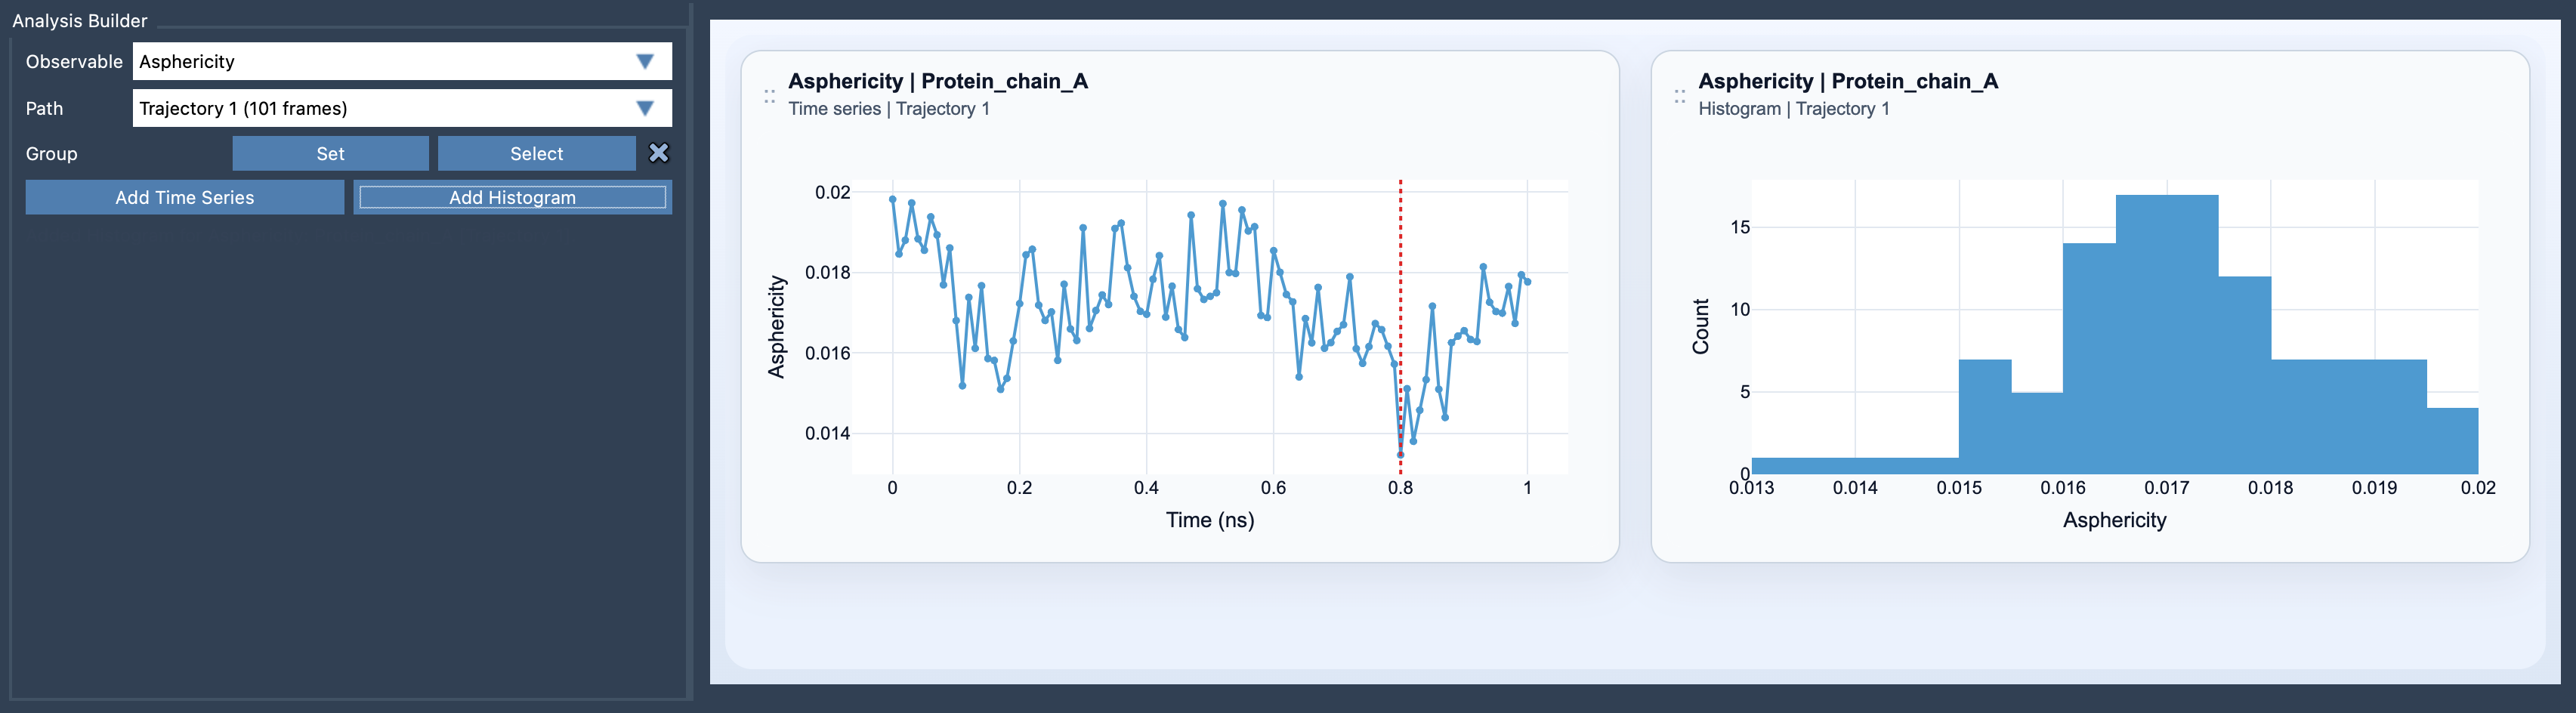
In SAMSON’s Path Analyzer, adding an asphericity plot is straightforward. You can visualize the data as a time series or histogram to better understand your system:
- Open the Path Analyzer tool.
- Choose the Asphericity option under Observable.
- Select the specific Path you want to analyze.
- Define the Group (e.g., molecule or group of atoms) to study.
- Click Add Time Series or Add Histogram to generate the desired visualization.
Output Views
The Path Analyzer offers two complementary views for your asphericity analysis:
- Time series: Observe how the asphericity evolves along the trajectory or path.
- Histogram: Examine the distribution of asphericity values sampled over the defined time or spatial range.
Tips for Effective Analysis
To fully leverage asphericity, consider pairing it with tools like radius of gyration and shape parameter within the Path Analyzer. These combined measurements enable you to capture nuanced and global insights into molecular dynamics and structural changes.
For example:
- If your radius of gyration analysis indicates a constant overall size but ignores subtle shape changes, asphericity can detect elongations, flattenings, or more localized anisotropic effects.
- Using the histogram view is particularly effective for determining whether your system dwells predominantly in spherical or anisotropic conformations.
By incorporating asphericity into your workflow, you gain a more comprehensive perspective on molecular structure and dynamics. This, in turn, can enhance the accuracy of your conclusions in structural biology, drug design, and similar fields.
Learn more about asphericity and how it integrates into the Path Analyzer by visiting the detailed documentation page here: https://documentation.samson-connect.net/users/latest/references/path-analyzer/asphericity/.
SAMSON and all SAMSON Extensions are free for non-commercial use. To get started with SAMSON, visit https://www.samson-connect.net.