



Molecular modelers often struggle with understanding how different parts of a molecular complex interact during dynamic simulations. Are the interactions stable? When do key residues come into contact? How do domain interfaces change over time? These kinds of questions are crucial for those investigating protein-protein binding, ligand docking, or structural flexibility. Fortunately, SAMSON’s Contacts analysis provides a practical way to address these challenges.
What is Contact Analysis?
The Contacts feature in SAMSON tracks how often feature pairs (like residues in two different chains) come into contact during a simulation. Beyond detecting contacts, it generates informative visualizations like series plots and heatmaps to summarize the occupancy of these contacts over time. These tools can help you pinpoint when interfaces form, break, or undergo significant structural changes.
For example, if you’re studying a drug binding to a protein, the analysis lets you observe when the binding occurs, how stable it is, and which residues are responsible for maintaining the binding. Similarly, in multi-domain proteins, it can reveal shifts in interface stability as the domains move relative to each other.
Adding a Contact Plot
Setting up a contact analysis in SAMSON is simple. Here’s a step-by-step guide:
- Open the Path Analyzer tool in SAMSON.
- Select Contacts as the observable variable to analyze.
- Choose the Path, which should correspond to your simulation trajectory.
- Define two groups of atoms: Group A and Group B. These groups will make up the two axes of your contact map. For meaningful results, select residues, ligands, chains, or domains rather than all atoms.
- Set a contact Cutoff value, which determines the maximum distance (in Å) for two atoms to be considered “in contact.”
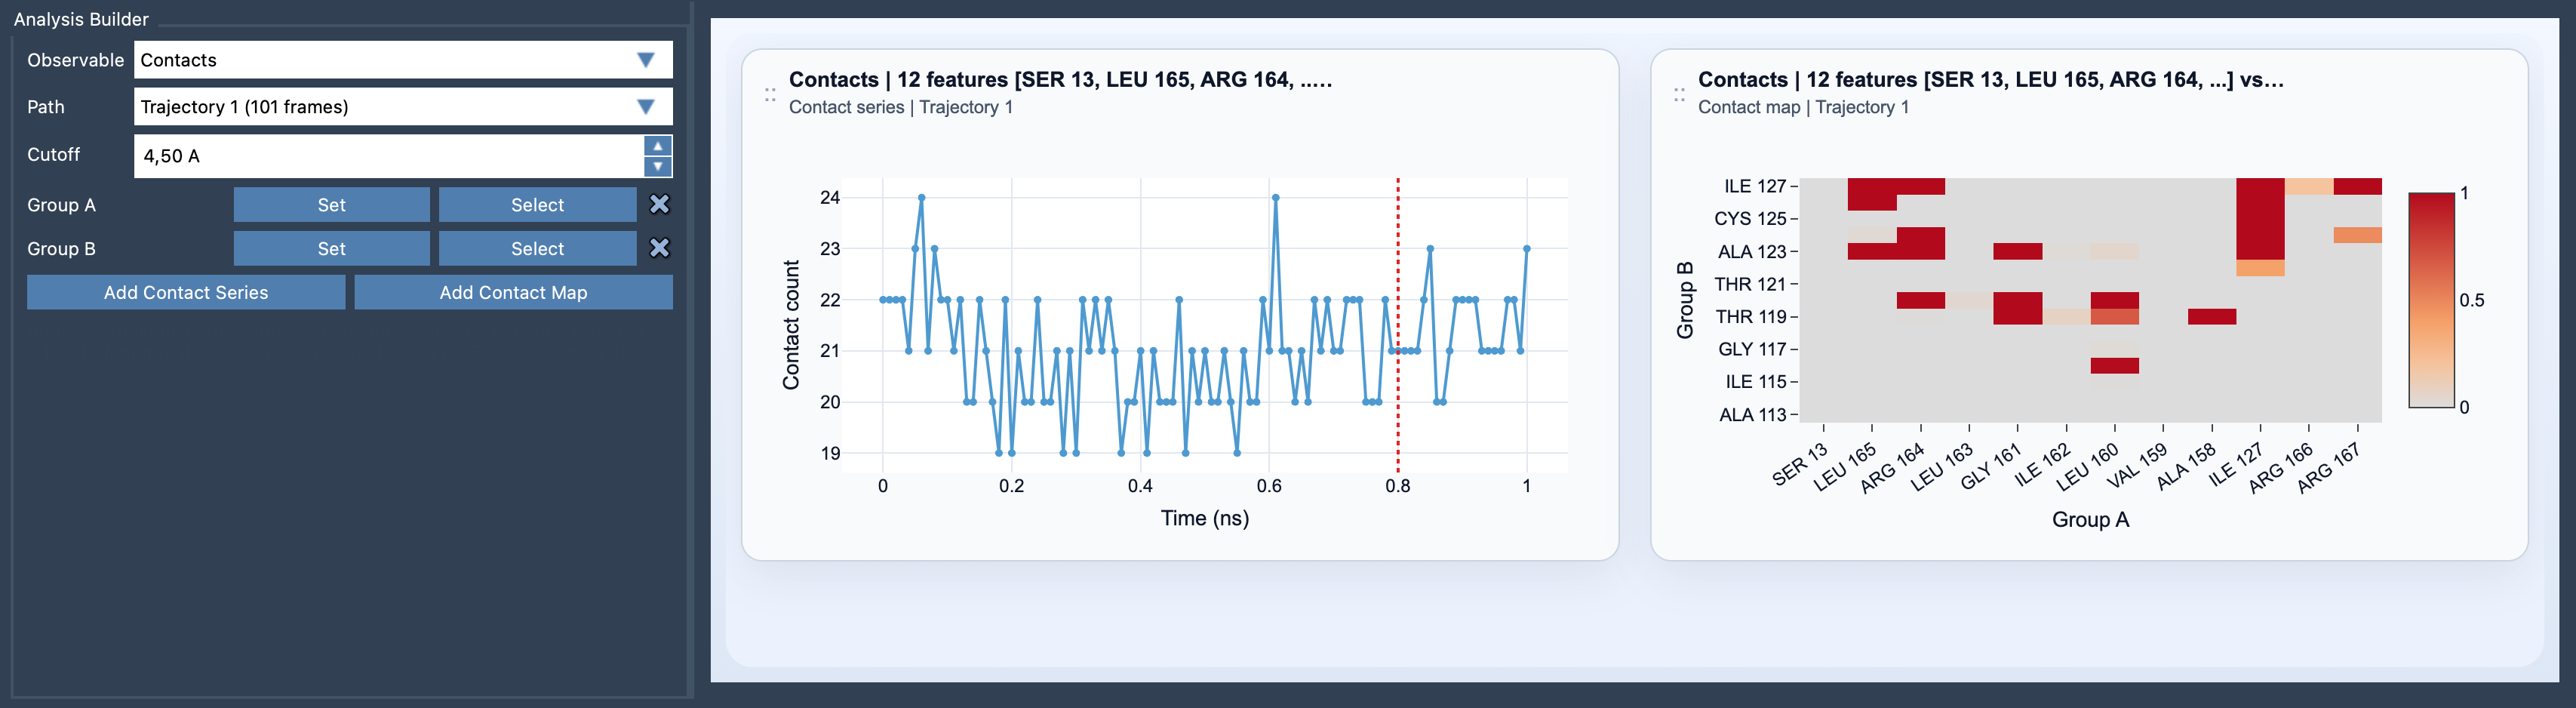
- Click Add Contact Series to generate a series plot or Add Contact Map for the heatmap visualization.
These straightforward steps enable you to explore dynamic interactions in greater detail.
Choosing the Right Visualization
Once you’ve added the plot, you can opt for two main visualization types:
- Contact Series: This shows the total number of contacts between the selected groups for every frame in the path. It’s great for identifying significant events, like when an interface forms or breaks.
- Contact Map: This presents a heatmap summarizing how often individual pairs of features (e.g., residue pairs) are in contact across the entire simulation. It’s perfect for pinpointing which pairs of atoms are critical to interactions.
For example, the contact series could show a spike when a ligand binds to a protein’s active site, while the contact map would highlight which residues form the key binding pocket.
Tips to Make the Most of Contact Analysis
The Contacts feature is a versatile tool for studying molecular interactions. To maximize its utility, keep the following tips in mind:
- Use the contact series plot to identify when dynamic events occur, such as the formation or disruption of interactions between domains or ligands.
- Leverage the contact map to zero in on critical feature pairs that drive these dynamic changes.
- If you need detailed pairwise information over time, consider combining this analysis with Contact Persistence, which provides a full binary time history for each contact pair.
Whether you’re studying protein folding, docking, or any other dynamic system, contact analysis can bring clarity to complex interactions. By using these tools, molecular modelers can better understand and interpret their simulations.
For more information and a detailed step-by-step guide to using the Contacts feature, visit the official SAMSON documentation page.
Note: SAMSON and all SAMSON Extensions are free for non-commercial use. You can download SAMSON at samson-connect.net.