



For molecular modelers, tracking how a molecular structure changes in shape and size over a trajectory is a fundamental part of analyzing systems. Are your molecules compacting, expanding, or showing large-scale shape transformations? These are often the key questions when studying molecular folding, aggregation, or structural dynamics. This is where the Radius of Gyration comes in—a valuable, straightforward tool for assessing molecular compactness.
What is Radius of Gyration?
The Radius of Gyration measures the overall compactness of a selected group of atoms. By analyzing this property along a path or trajectory, one can monitor significant behavior, such as folding in proteins, collapse of polymer chains, or large-scale swelling. It is a simple but powerful diagnostic tool for capturing both expansion and contraction events within molecular systems.
Here’s why this metric matters: compactness directly relates to how a molecular system behaves under different conditions. For instance, during folding simulations of proteins, the trajectory of the Radius of Gyration can pinpoint whether the system is moving toward a native-like structure or away from it. Similarly, for polymer simulations, it can help characterize how molecular size changes in response to environmental stimuli.
Adding the Radius of Gyration Plot in SAMSON
If you are using the SAMSON Path Analyzer to analyze your molecular system, plotting the Radius of Gyration is a straightforward process. Here’s how to get started:
- Launch Path Analyzer in SAMSON.
- In the Observable menu, select Radius of Gyration.
- Specify the Path you wish to analyze.
- Define the group of atoms to include in your analysis. (At least one atom-containing selection is required.)
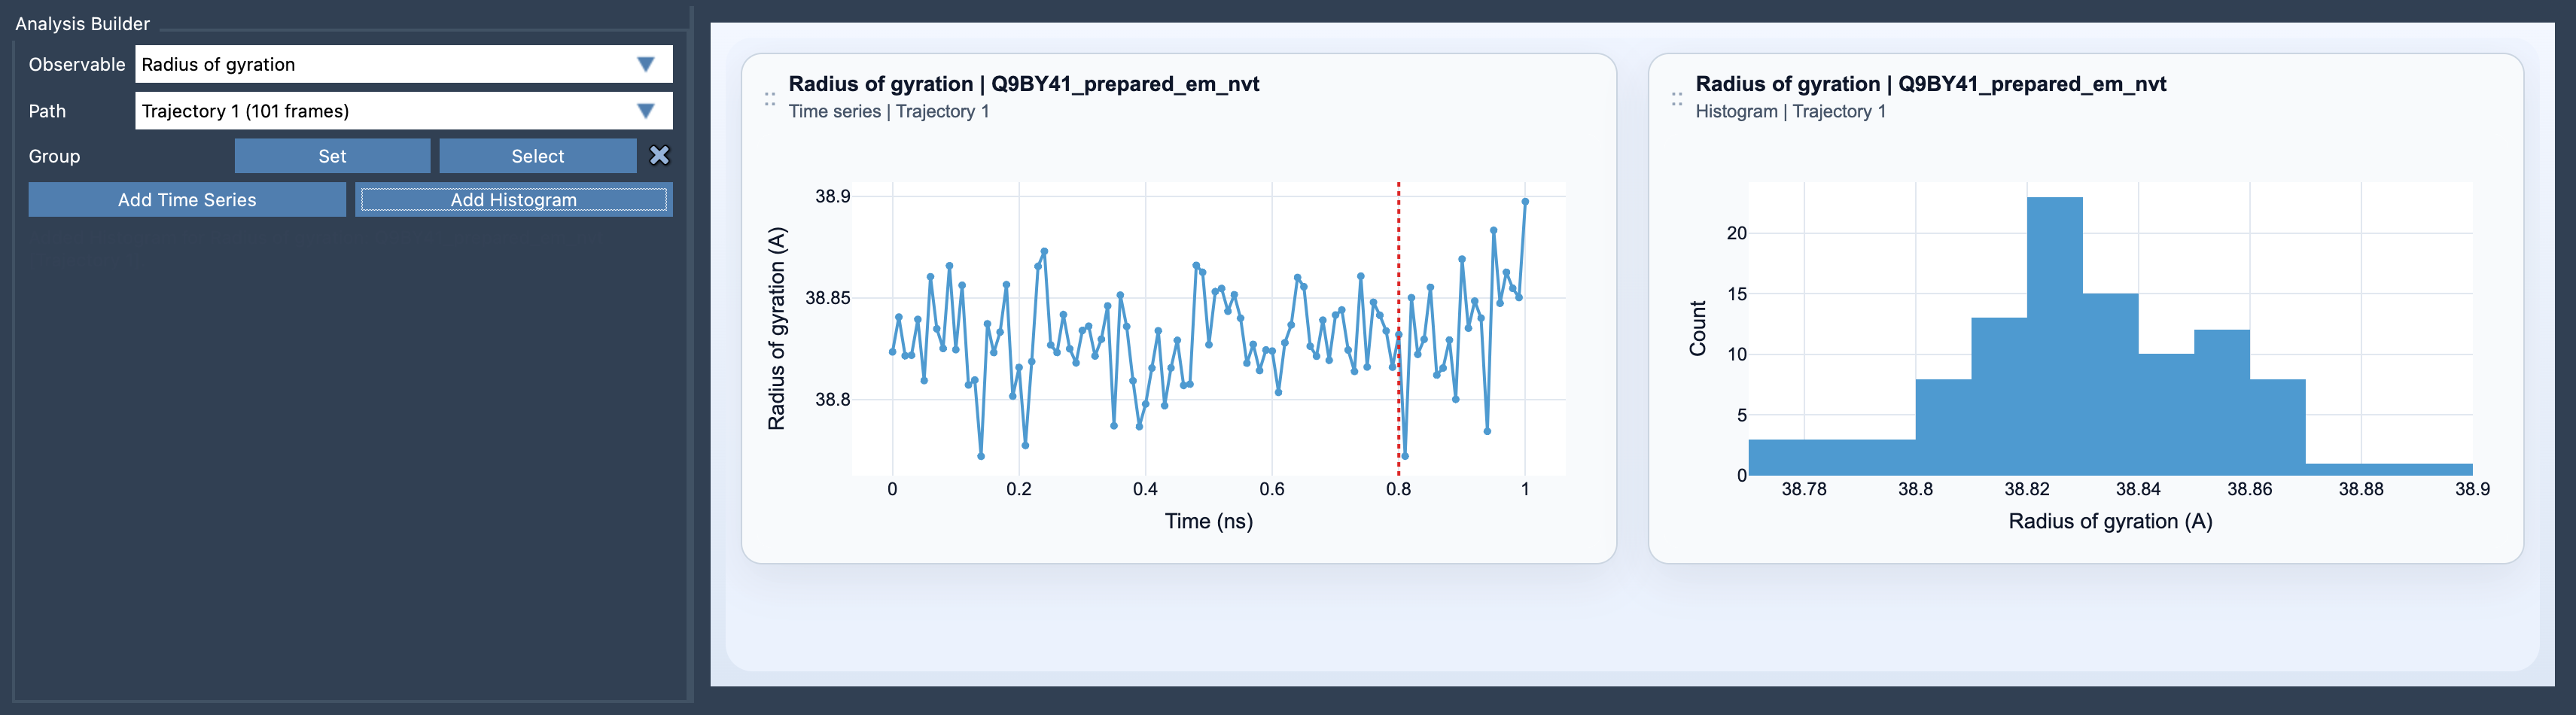
- Finally, choose whether to add a Time Series or Histogram view to visualize your data.
Once added, you’ll have a clear visual representation of how the compactness changes over time or which compactness range your system prefers.
Visualization Options
SAMSON provides two primary ways to visualize the Radius of Gyration:
- Time Series: Examine how the compactness evolves along the path, ideal for dynamic trajectories or time-resolved data.
- Histogram: Analyze the distribution of compactness to get insights into preferred structural states.
Both visualization types complement one another, allowing you to monitor trends while also identifying stable or dominant configurations.
Pro Tips for Molecular Modelers
If you want to maximize your insights from the Radius of Gyration analysis, consider pairing it with additional metrics:
- Combine it with Asphericity or Shape Parameter analysis to go beyond compactness and uncover how the structure changes in shape.
- Use it as a baseline analysis for multiple experimental or modeling conditions to compare folding efficiency or response to stimuli.
Learn More
By integrating Radius of Gyration analysis into your molecular modeling workflow, you’ll be equipped to monitor compactness, gain structural insights, and refine your system understanding. To dive into the finer details, visit the official documentation.
SAMSON and all SAMSON Extensions are free for non-commercial use. Download SAMSON today at https://www.samson-connect.net.