



Molecular modelers often face the challenge of distinguishing between overall rigid-body movements and internal structural changes in their simulations. This distinction is essential to analyze conformational flexibility, evaluate structural stability, or investigate binding mechanisms. This is where Root Mean Square Deviation (RMSD) analysis, available in the SAMSON Path Analyzer, plays a vital role.
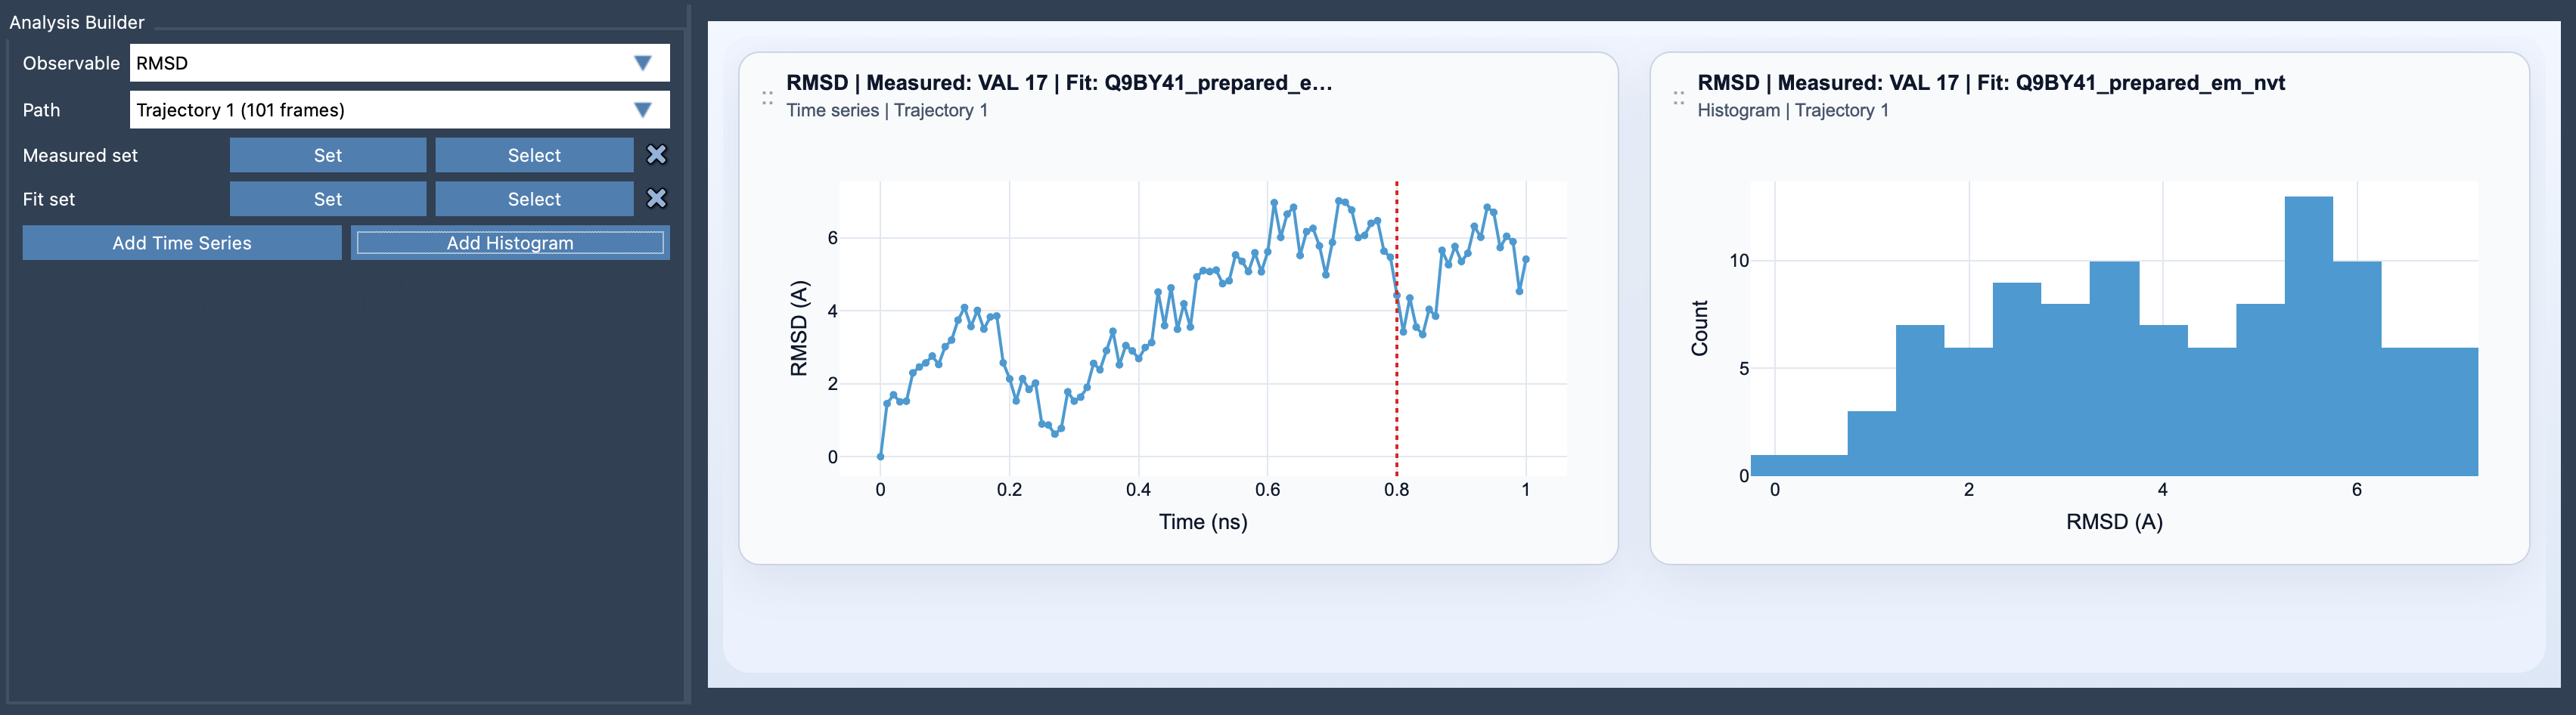
The RMSD analysis measures how much the structural conformation (a set of selected atoms) deviates over time relative to a reference state, typically the first frame. Importantly, it removes the effects of rigid-body motions by aligning each frame to the reference, allowing you to isolate and analyze only the internal structural changes. Here’s how you can use this powerful feature within SAMSON:
How to Add an RMSD Plot in SAMSON
Generating an insightful RMSD plot in SAMSON is a straightforward process. Follow these steps:
- Navigate to the Path Analyzer workspace in SAMSON.
- Select RMSD under the “Observable” options menu.
- Choose the trajectory or path you want to analyze.
- Define two critical atom-containing selections: a Fit set and a Measured set. The Fit set aligns the frames, while the Measured set is used for deviation analysis.
- Click on either Add Time Series to track deviations over time or Add Histogram to evaluate the RMSD distribution.
Tips for Effective RMSD Analysis
To get the most insightful results, consider these tips while conducting RMSD analysis:
- Choose your Fit set wisely: Use a stable, rigid structure like the backbone of a protein, a ligand-binding scaffold, or a core domain. A well-chosen Fit set ensures consistent alignment and minimizes inaccuracies.
- Analyze flexible regions: When isolating motions of interest, set the Measured set to encompass flexible regions, like loop structures or ligand-binding pockets, to focus on their dynamics.
- Use complementary metrics: Pair RMSD analysis with other observables, such as the Radius of Gyration, Distance, or Energy. For instance, combining RMSD and Radius of Gyration can help you understand whether deviations are driven by local rearrangements or significant structural unfolding.
Gain Deeper Insights with Visualization
Both visualization modes—Time Series and Histogram—offer valuable insights into your molecular system:
- Time Series: Tracks RMSD frame-by-frame, letting you monitor where, when, and how deviations occur.
- Histogram: Displays the distribution of RMSD data, helping you identify common structural states versus rare excursions.
For further interaction, you can select and explore specific points on these plots. Clicking a point moves the structure to its corresponding frame, and double-clicking highlights the measured features within SAMSON for intuitive exploration.
Why Use RMSD in Your Modeling Workflow?
RMSD analysis offers valuable information to answer questions like:
- How stable is your molecular system’s conformation over time?
- Do structural changes correlate with external events, such as ligand binding or environmental shifts?
- What regions of the system are inherently flexible versus rigid?
By leveraging the tools offered in SAMSON’s Path Analyzer alongside RMSD, you can dive deeper into your molecular data.
To learn more, visit the official documentation page for RMSD analysis: RMSD Analysis Documentation.
Note: SAMSON and all SAMSON Extensions are free for non-commercial use. Get SAMSON here.