


For molecular modelers, ensuring accurate protein structures is of paramount importance. A key challenge lies in identifying and refining backbone conformations in proteins to ensure they adhere to energetically favorable configurations. Enter the Ramachandran Plot – an essential tool for visualizing and improving protein backbone dihedral angles.
What is a Ramachandran Plot?
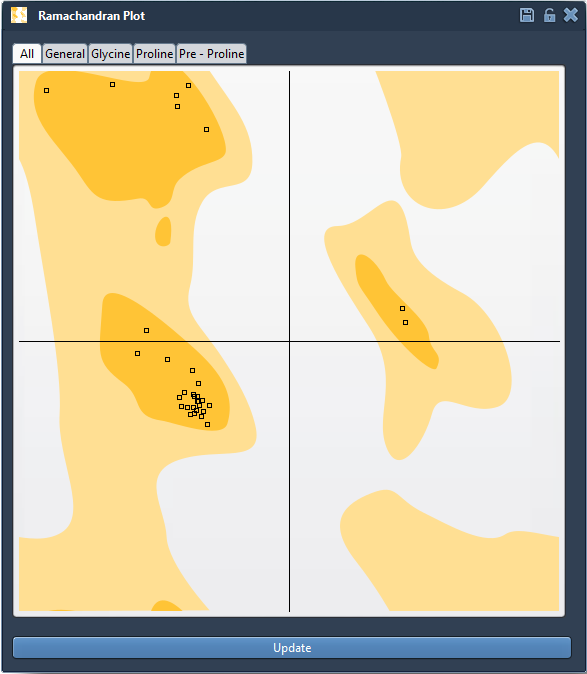
The Ramachandran plot maps out the allowed and disallowed regions for backbone dihedral angles φ (phi) and ψ (psi) in amino acids of a protein. It is a valuable visualization that helps identify residues with conformations that may be strained or energetically unfavorable.
This tool reveals:
- Yellow regions: Energetically favorable conformations.
- White regions: Energetically unfavorable conformations.
Such insights are critical in applications like structure refinement and identifying potential molecular issues before simulations.
How to Use the Interactive Ramachandran Plot
With SAMSON’s Interactive Ramachandran Plot Extension, you can actively explore, validate, and edit φ and ψ angles for residues. Here’s how to make the most of it.
Step 1: Visualizing the Plot
Begin by loading a protein structure – such as PDB ID 1YRF – into SAMSON. Then, open the Ramachandran Plot app through Home > Apps > Biology > Ramachandran plot. Once loaded, click Update to generate the plot. Tabs in the app allow you to filter residues by type:
- All: Displays all residues.
- Glycine: Filters residues with unique flexibility properties.
- Proline: Focuses on residues with restricted φ angles.
- Pre-proline: Highlights residues immediately preceding prolines.
Step 2: Exploring a Residue
Click on any residue in the plot to explore its properties. For example, selecting a proline highlights its position in the protein viewport and displays its dihedral angles (φ and ψ) in the status bar:

Step 3: Interactive Refinement
Refining residues has never been so intuitive. The Interactive Ramachandran Plot offers two main editing options:
- Drag in the Plot: Simply drag a data point on the plot to edit corresponding φ and ψ values in real-time. The protein’s 3D structure updates instantly.
- Twister Editor: Use the Twister editor to manually adjust the protein’s structure in 3D space, while observing the plot update interactively. This method provides deeper control over subtle adjustments:
Evaluating Your Refinement
Once residues are placed in favorable regions of the Ramachandran plot, you achieve a balance between structural validity and energy optimization. Proper refinement can enhance downstream applications such as molecular simulations, homology modeling, and active site analysis.
Learn More
The Ramachandran Plot offers powerful insights into protein conformations. To dive deeper, explore the official documentation page here: https://documentation.samson-connect.net/tutorials/ramachandran/ramachandran-plot/.
*Note: SAMSON and all SAMSON Extensions are free for non-commercial use. Get SAMSON here: https://www.samson-connect.net.