



Protein dynamics can be a complex and fascinating process, but visualizing changes in secondary structure over time can make studying these dynamics much easier. If you work in molecular modeling, you may often need to monitor how much of a protein’s structure is α-helical, β-sheet, or unstructured. Understanding these changes can provide critical insights, especially when studying protein folding, interactions, or structural transitions under various conditions.
This is where the Secondary Structure Content tool in SAMSON’s Path Analyzer comes into play. It allows you to follow how a protein’s secondary structure evolves along a trajectory, offering a clear and high-level summary of backbone-state changes.
Why Monitor Secondary Structure?
Changes in secondary structure can reveal important information about a protein’s stability, folding states, or functional domains. For example, a shift from alpha-helix to beta-sheet might indicate unfolding or aggregation. Alternatively, unstructured regions adopting specific structures could hint at functional activation. With the Secondary Structure Content tool, you can systematically capture and quantify these changes in a simple visualization.
How Does It Work?
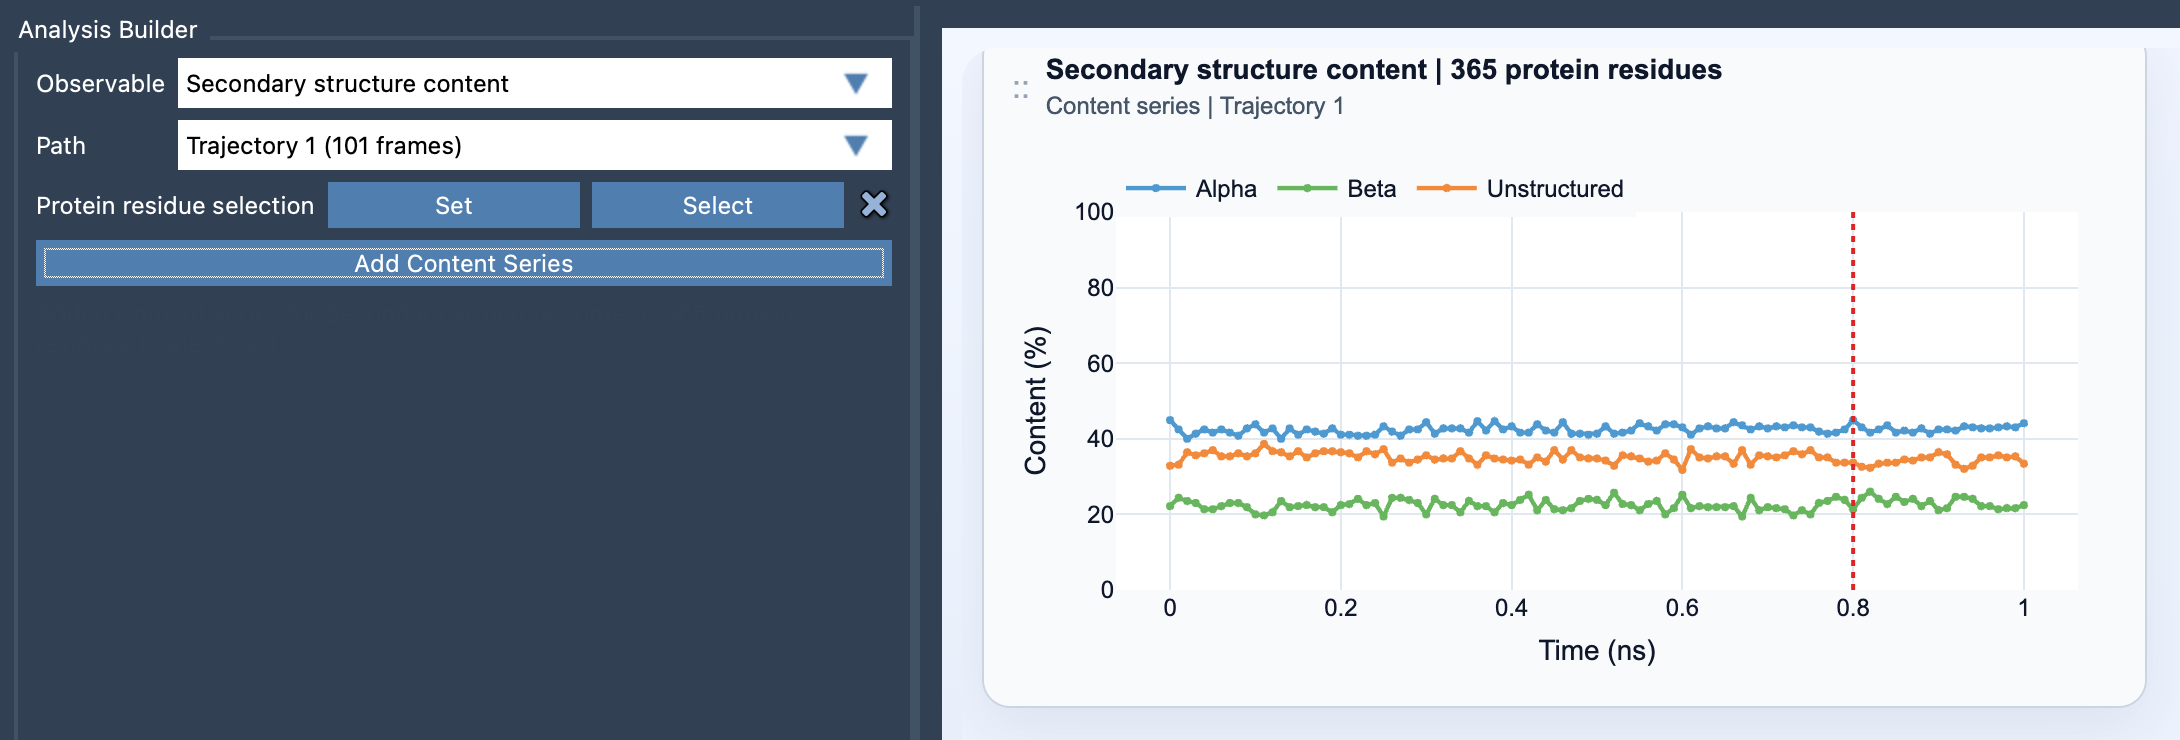
The tool computes the secondary structure content for a specific protein selection at each frame of a trajectory. A time-resolved plot shows percentages of:
Alpha(percentage of residues in α-helix structures)Beta(percentage of residues in β-sheet structures)Unstructured(percentage of residues without defined secondary structure)
Step-by-Step Guide to Add a Plot
Let’s break down how you can use the tool effectively:
- Open the Path Analyzer in SAMSON.
- Select Secondary Structure Content in the Observable dropdown menu.
- Choose a Path (trajectory) that represents your protein’s dynamics.
- Specify your Protein residue selection. You can select the entire protein, a single domain, or just a specific region of interest (like a helix bundle or loop-rich segment).
- Click on Add Content Series to generate the chart.
Customizing Your Analysis
The beauty of this tool lies in its flexibility:
- For a broad summary, you can analyze the secondary structure content across the whole protein.
- To zoom in on specific dynamics, focus on a specific subset like a single loop or domain.
You can even combine this tool with others, such as the Ramachandran plot, for residue-level backbone details. Together, these tools offer complementary levels of detail, helping you connect the high-level overview with residue-specific insights.
Equations Behind the Tool
The calculations are derived from residue counts for α, β, and unstructured regions at each frame of your trajectory. Percentages are computed as:
%Alpha(t) = 100 × Nα(t) / Nres, where Nα(t) is the count of α-helix residues at time t, and Nres is the total number of selected protein residues.
Similar calculations apply for beta-strand (%Beta(t)) and unstructured regions (%Unstructured(t)), allowing for a precise breakdown at every step of your trajectory.
Tips for Effective Use
Here are some tips to enhance your secondary structure analysis:
- Use broad selections if you want a summary of the entire protein’s structural dynamics.
- Focus on specific regions of interest (like active sites or flexible domains) to track local structural variations.
- Pair with the Ramachandran plot to gain complementary residue-specific insights about backbone dihedrals.
Whether you are analyzing protein stability, studying folding pathways, or investigating interaction dynamics, this tool offers a straightforward way to summarize complex structural changes.
Want to dive deeper into the Secondary Structure Content feature? Explore the full documentation here: https://documentation.samson-connect.net/users/latest/references/path-analyzer/secondary-structure-content/.
Note: SAMSON and all SAMSON Extensions are free for non-commercial use. Download SAMSON now at https://www.samson-connect.net.