



For molecular modelers, unraveling the microscopic organization of molecules is a daily challenge. One common question is: how are molecules or groups of atoms spatially distributed relative to one another? This is where the Radial Distribution Function (RDF) becomes indispensable. In this blog post, we’ll delve into how SAMSON’s RDF analysis can help decode local packing, solvation structures, and interaction distances, providing clarity on microscopic molecular arrangements.
What is RDF Analysis and Why Use It?
The RDF analysis in SAMSON computes the radial distribution function between two predefined atom or molecular groups. This allows modelers to:
- Analyze local molecular packing.
- Understand solvation structures, e.g., how solvents interact with solutes.
- Measure important interaction distances critical for understanding molecular behavior.
The result? A one-dimensional RDF curve that shows the density of molecular pairs as a function of distance, helping you explore structural patterns more effectively.
Step-by-Step: Adding an RDF Plot
Setting up an RDF plot in SAMSON is straightforward and allows quick customization for specific molecular systems. Below is a step-by-step process to guide you:
- Launch Path Analyzer.
- Select RDF from the Observable options.
- Choose a molecular pathway, then define Group A and Group B (e.g., solutes and solvents).
- Specify the Maximum radius (extent of the analysis) and Bin width (resolution of the RDF curve).
- Click Add RDF, and the system will generate the radial distribution curve.
This allows you to compare and visualize molecular packing or interactions with a few clicks, saving time while enhancing interpretability.
Key Considerations for Inputs
To ensure meaningful results, remember these key points:
- You need two atom-containing groups to perform the analysis.
- The
Maximum radiusdetermines the distance range for sampling the RDF. - The
Bin widthshould be fine enough to resolve critical peaks without introducing excessive noise.
Practical Tips for Better Results
Getting an accurate RDF curve requires thoughtful input configuration. Here are two practical tips:
- Select atom groups that are chemically meaningful, such as solute-solvent pairs or ligand-pocket interactions, to extract insights about structural organization.
- Adjust the bin width based on your study’s needs: finer bins for detailed patterns, or wider bins for smoother trends.
Insights from Visualizing the RDF
Once generated, the RDF curve reveals how molecular density varies with distance. For periodic systems, SAMSON can normalize the results, so the curve reflects ideal-gas behavior, increasing interpretability. Without periodic cell information, SAMSON provides an RDF-like curve with intuitive signals in arbitrary units.
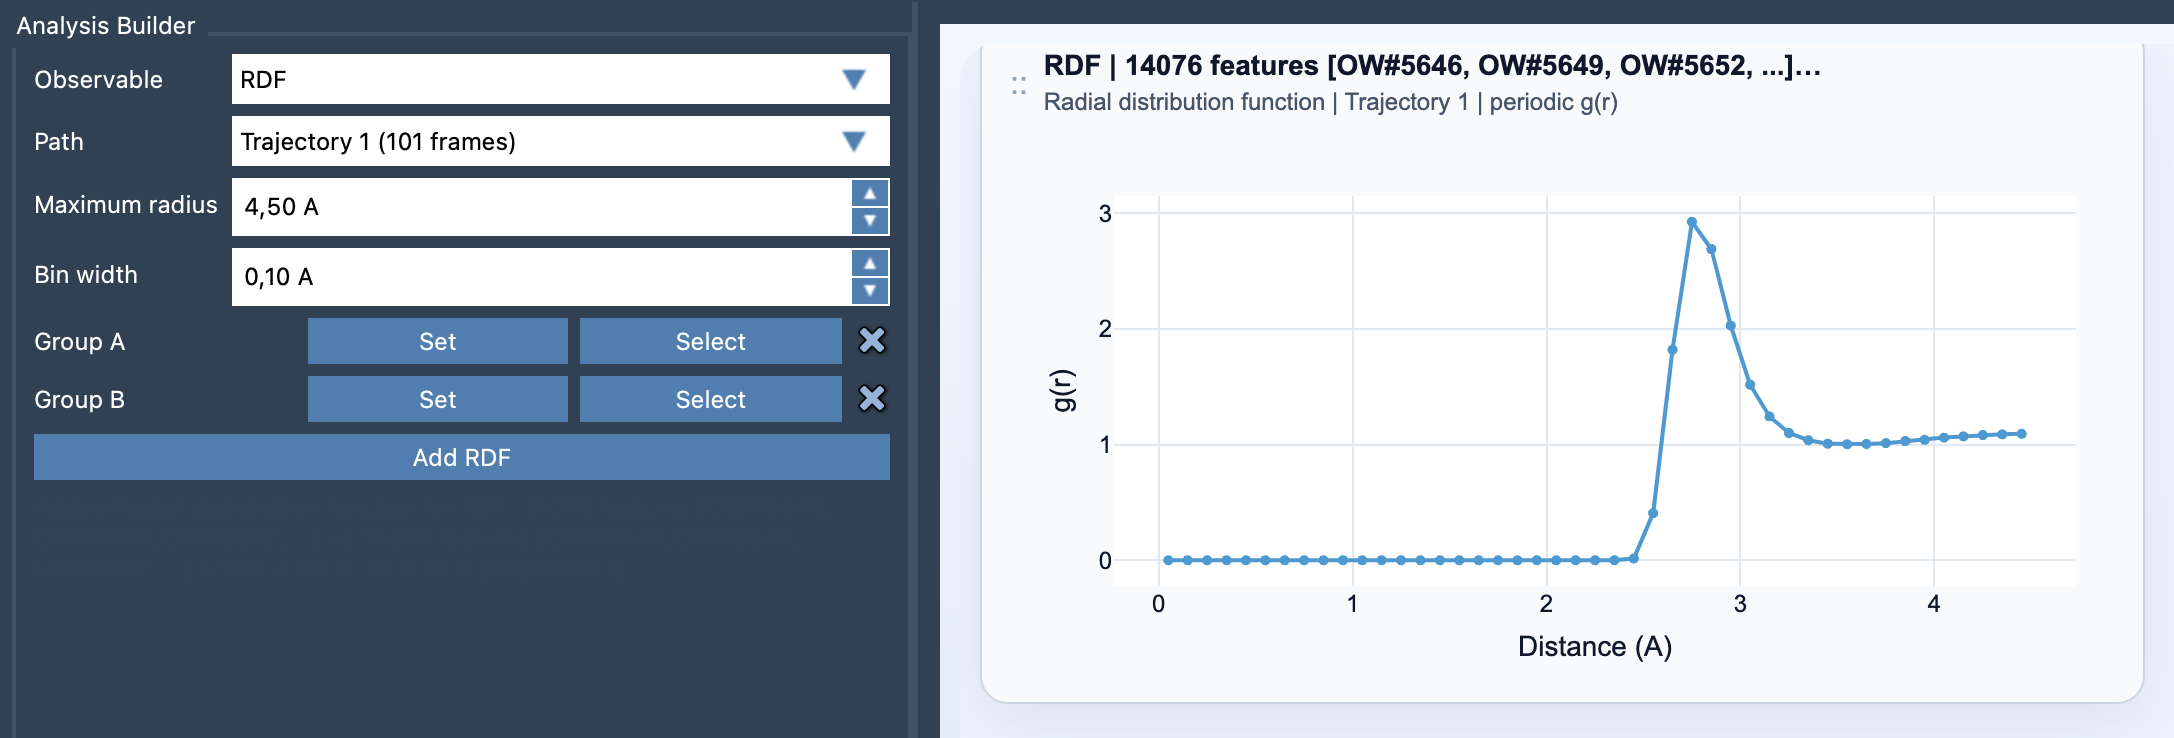
Looking at these curves will allow you to identify peaks indicating preferred molecular distances and troughs showing repulsions, making it easier to infer molecular structure and dynamics.
Where to Learn More?
Understanding RDF analysis is key to improving your molecular modeling workflows. To learn more about RDFs and how they are implemented in SAMSON, consult the official documentation.
SAMSON and all SAMSON Extensions are free for non-commercial use. You can download SAMSON and start exploring today at SAMSON Connect.