



Molecular modelers often need to dive deep into the structural organization of molecules and their interactions. Whether you’re studying solvation shell structures, local packing around a molecule, or the characteristic distances for interactions, understanding Radial Distribution Functions (RDF) can make all the difference.
In this article, we’ll explore how RDF analysis, available in the Path Analyzer tool within SAMSON, can help you gain insights into these aspects of molecular systems.
What is RDF Analysis?
RDF, or Radial Distribution Function, is a mathematical tool that measures how particle density varies as a function of distance from a reference particle. It’s extremely powerful for analyzing local molecular organization in scenarios such as:
- Solvent molecules surrounding a solute (solvation shell).
- Atomic packing in crystalline or densely packed structures.
- Characterizing distances between specific molecular features (e.g., ligand and binding pocket).
By offering a density-vs-distance curve, RDF can reveal where molecules tend to cluster or interact most significantly. Even a complex molecular system can often exhibit meaningful patterns thanks to RDF analysis.
How Can You Compute RDFs?
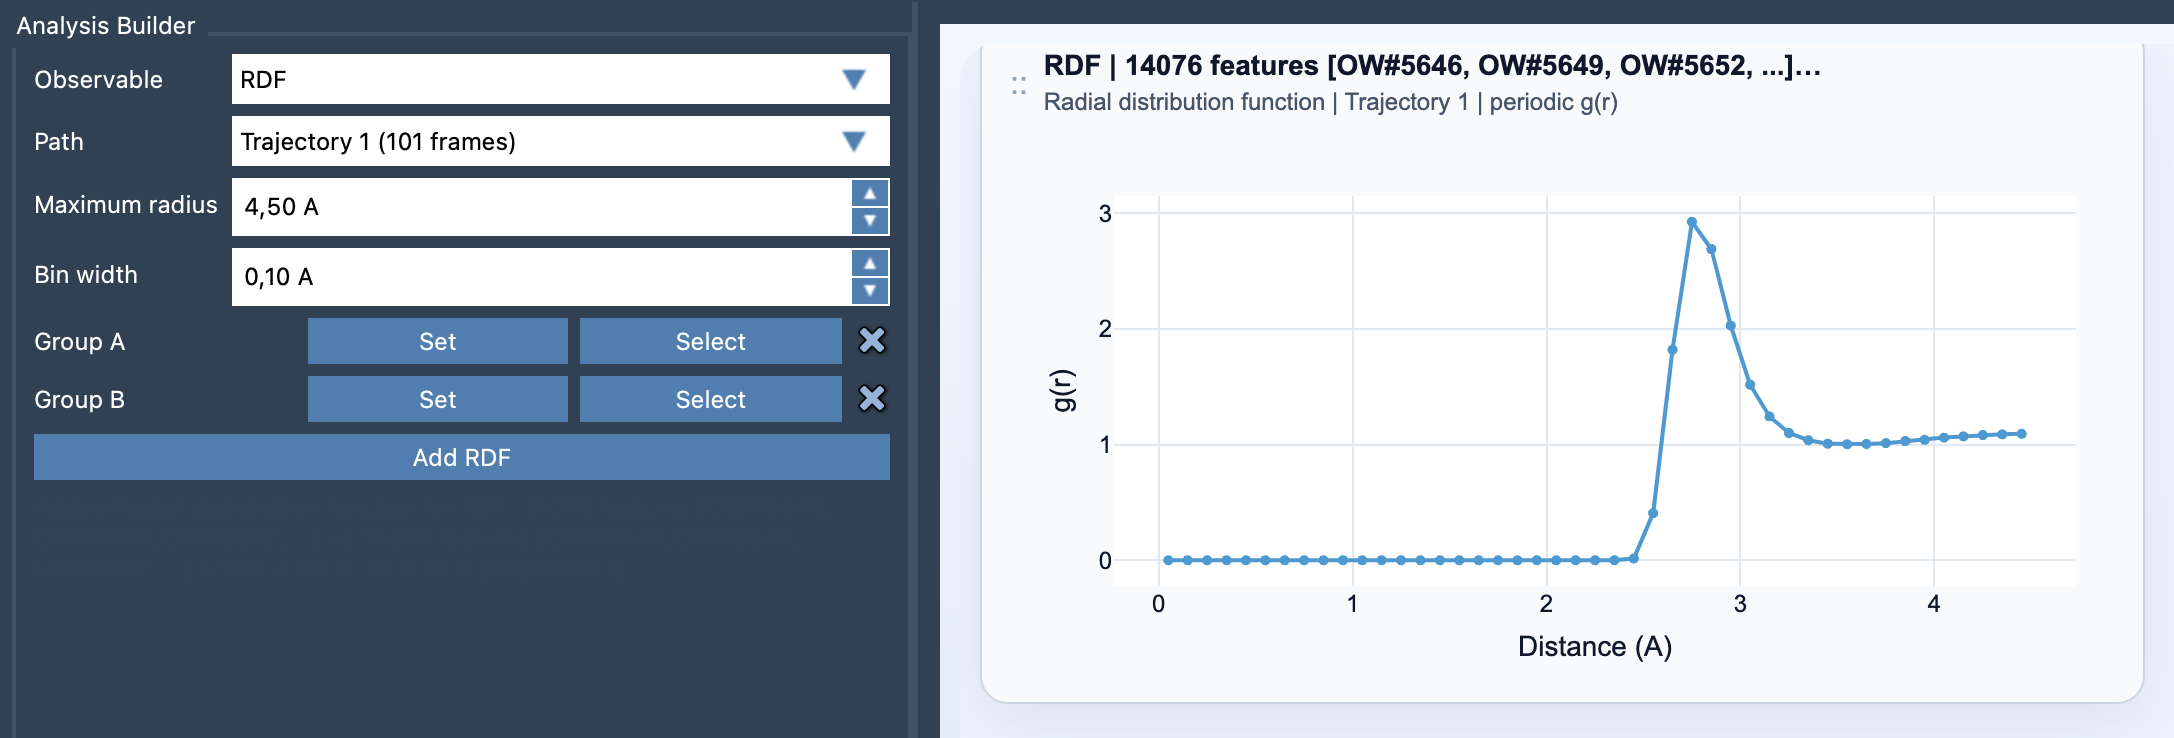
The Path Analyzer app in SAMSON provides an easy way to compute and visualize Radial Distribution Functions. Here’s how:
- Open the Path Analyzer.
- In the Observable section, select RDF.
- Define a Path (the scope of interest).
- Select two groups of atoms: Group A (e.g., solute atoms) and Group B (e.g., solvent atoms).
- Set parameters like the Maximum radius (to define the distance range for analysis) and Bin width (for radial resolution).
- Click Add RDF to visualize the curve.
Tips for Maximizing Insights
To get the most out of RDF analysis, here are some practical guidelines:
- Meaningful Groups: Carefully define chemically relevant groups for Group A and Group B. For example, study solute-solvent, ligand-receptor, or even residue-residue pairs of interest.
- Bin Width: Ensure that the bin width is fine enough to resolve features in the curve yet broad enough to avoid noise from statistical fluctuations.
- Periodic Normalization: If unit cell data is available, take advantage of it to normalize the RDF, yielding a properly scaled function
g(r).
From the Curve to Interpretations
The result of an RDF computation is a one-dimensional curve indicating density or likelihood as a function of distance. Peaks in the curve signify areas where particles or atoms are more likely to be found. For instance:
- A distinct first peak might indicate the solvation shell radius around an ion or molecule.
- Subsequent peaks could help track long-range ordering in dense or periodic systems.
With this analysis, molecular modelers can make data-driven conclusions about interactions and structural organization in their system of interest.
For more details and advanced usage, please refer to the official Path Analyzer documentation here.
Note: SAMSON and all SAMSON Extensions are free for non-commercial use. Get SAMSON at https://www.samson-connect.net.