


When studying the molecular world, understanding how components are distributed around each other is essential, whether you’re delving into solvation structures, evaluating drug interactions, or analyzing local packing. This is where Radial Distribution Function (RDF) analysis becomes valuable. In this blog post, we'll explore how the RDF analysis tool in SAMSON's Path Analyzer can help you uncover important insights about molecular systems.
What is RDF?
The Radial Distribution Function (RDF) is a measure of how atomic or molecular groups are spatially distributed relative to one another. For molecular modelers, RDF provides a mathematical way to observe local packing density, solvation structure, and interaction distances between two groups of atoms. Essentially, it answers the question: "At a given distance, how densely packed are the particles around a group of interest?"
Setting Up Your RDF Analysis in SAMSON
To start your RDF analysis using SAMSON's Path Analyzer, you can follow these simple steps:
- Open the Path Analyzer tool.
- Select RDF in the Observable parameter.
- Define your Path, which outlines the system's context for the analysis.
- Specify two groups of atoms as Group A and Group B. These selections form the primary focus of the computation.
- Set the Maximum radius (which determines the spatial range for the RDF calculation) and the Bin width (which adjusts the resolution).
- Click Add RDF to complete the setup and generate your distribution curve.
The tool returns a curve that serves as a one-dimensional visualization of density versus distance, offering a straightforward way to interpret molecular arrangements.
Key Inputs and Tips
To get the most value out of RDF analysis, it's important to use meaningful selections for Group A and Group B. For example:
- Solute-solvent interactions, which are crucial for understanding solution dynamics.
- Ligand-pocket interactions, often analyzed in drug design studies.
- Residue-residue contacts, instrumental in protein simulations.
Additionally, thoughtful parameter choices can make a big difference in the clarity of your results:
- A Bin width that is too fine might result in a noisy curve, while a width that is too coarse might smooth out crucial details.
- By selecting a Maximum radius that aligns with the actual distribution range of your system, you ensure computational efficiency without cutting off valuable data.
Beyond Simple RDF
When periodic cell information is available, the Path Analyzer tool in SAMSON normalizes the RDF values against expected ideal-gas occupancy. This normalization yields a properly scaled g(r), which is particularly useful for systems with periodic boundary conditions. If periodic data isn't accessible, the tool falls back to producing an RDF-like curve in arbitrary units, which, while unscaled, can still provide valuable insights into spatial distributions.
A Quick Note on Visualization
One of the strengths of SAMSON is its ability to summarize data visually. By generating an RDF curve, the tool provides a concise representation of local density variations as a function of distance. Here’s how it might look:
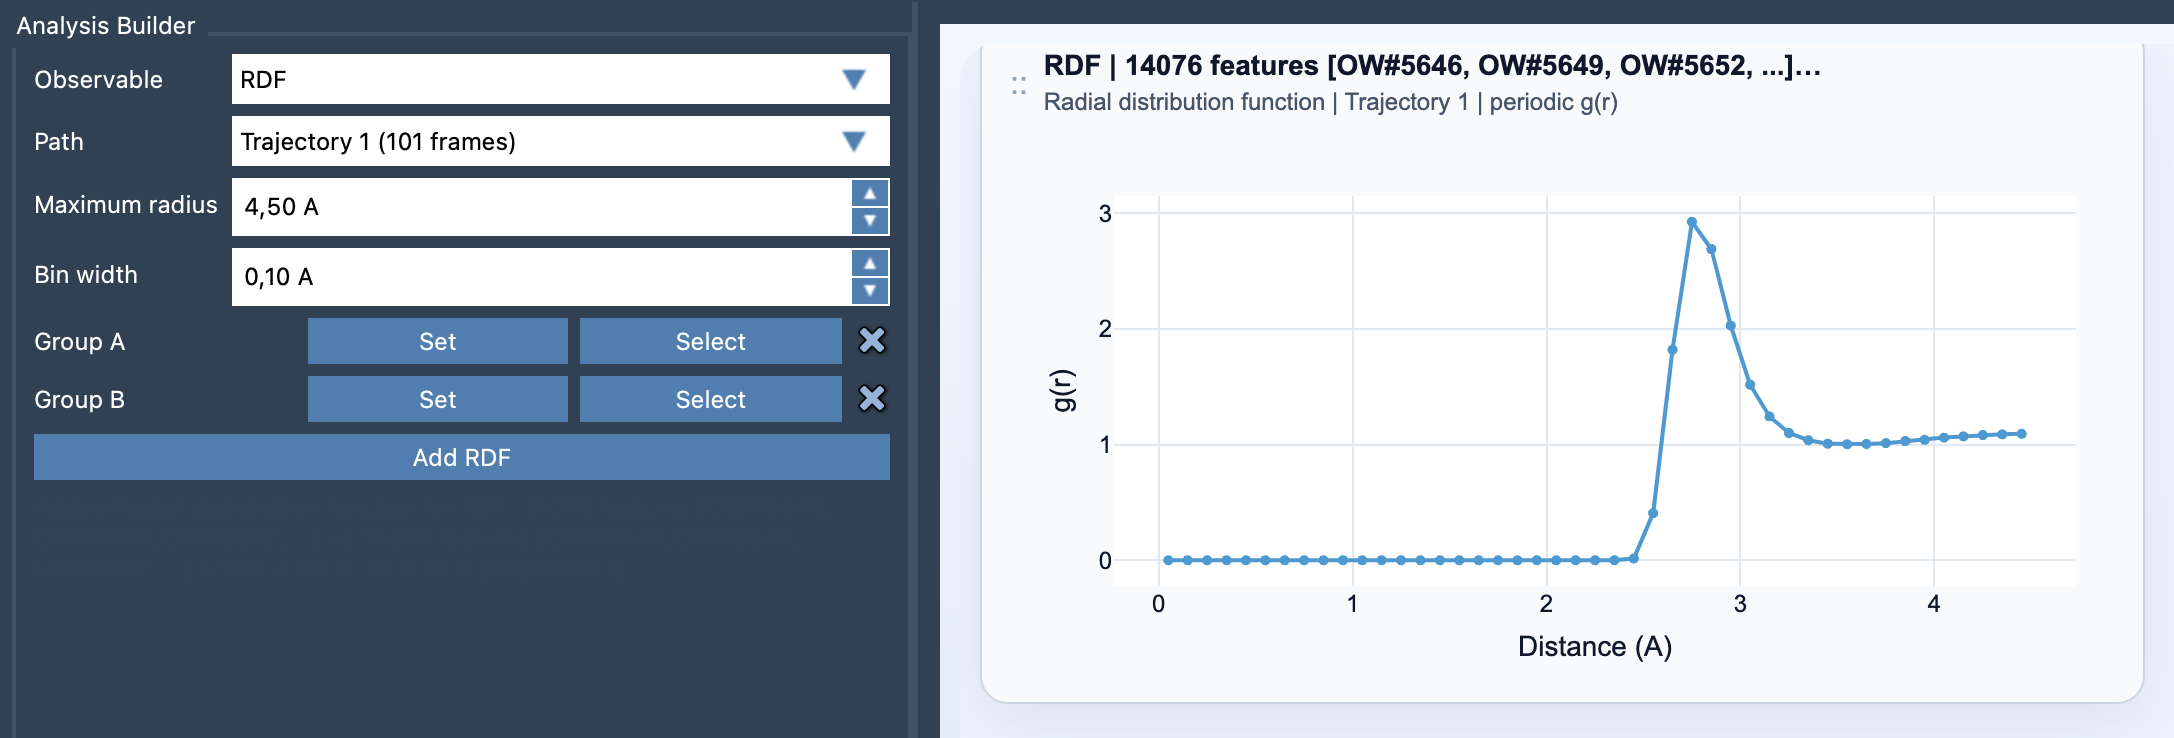
This one-dimensional density curve lets you see at a glance how atoms or groups are distributed and whether there are peaks that signal significant interaction distances. These results can aid in formulating hypotheses and designing experiments for further exploration.
Conclusion
If you're working on a project that involves understanding molecular packing, interatomic distances, or solvation shells, RDF analysis in SAMSON simplifies what could otherwise be a complex task. Its integration into the Path Analyzer allows for a straightforward workflow that produces actionable results.
To dive deeper into RDF analysis and explore additional tips and functions, visit the documentation page at this link.
Note: SAMSON and all SAMSON Extensions are free for non-commercial use. Download SAMSON at https://www.samson-connect.net.