



For many molecular modelers, moving from raw simulation data to actionable insights can be daunting. One such case arises when working with umbrella sampling simulations — extracting a Potential of Mean Force (PMF) profile can feel like a challenging step. Fortunately, the GROMACS Wizard within the SAMSON platform simplifies this process, allowing you to compute PMF profiles with ease, thanks to the Weighted Histogram Analysis Method (WHAM). Let’s explore how to efficiently compute and interpret PMF profiles using this tool.
Why PMF Analysis Matters
PMF analysis provides molecular modelers with crucial insights into the energy landscape along a specific reaction coordinate. It helps you understand critical phenomena such as binding/unbinding events, energy barriers, and pathway preferences in molecular systems. However, getting accurate PMF profiles relies heavily on properly formatted input data and a smooth workflow, or else your results might miss important details.
Preparing for PMF Analysis
Before diving into PMF computations, ensure you have completed the Umbrella Sampling workflow. A well-executed umbrella sampling workflow should yield windowed simulation data organized in folders, each corresponding to specific reaction coordinate values. Make sure your input folder contains:
- Numbered subfolders labeled for each window.
- A consistent reaction-coordinate setup across all subprojects.
How to Compute the PMF
Once your input folder is ready, follow these steps to compute your PMF profile in the GROMACS Wizard:
- Navigate to the WHAM Analysis tab in the GROMACS Wizard extension within SAMSON. This handy interface is specifically designed for PMF analysis.
- Select your project path manually or use the “auto-fill” option (
 ) if you’ve just completed the umbrella sampling simulation within the same session.
 - Verify that the numbered subdirectories in your input folders match your reaction-coordinate setup. This step ensures accurate downstream analysis.
- Choose the reaction coordinate you want to analyze from the list provided by the tool.
- Optionally, refine settings like custom bounds, energy units, or time ranges if your project requires special configurations.
- Click the Compute button to generate your PMF profile.
Interpreting the Results
Upon computation, the GROMACS Wizard generates a PMF profile along with a histogram. Here’s what each output tells you:
- The PMF Profile: This graph shows the free energy landscape along the reaction coordinate, revealing energy wells, barriers, and the overall pathway characteristics.
- The Histogram: This visual ensures your reaction-coordinate space is well-sampled. Sparse regions in this histogram indicate windows that might require additional sampling for better accuracy.
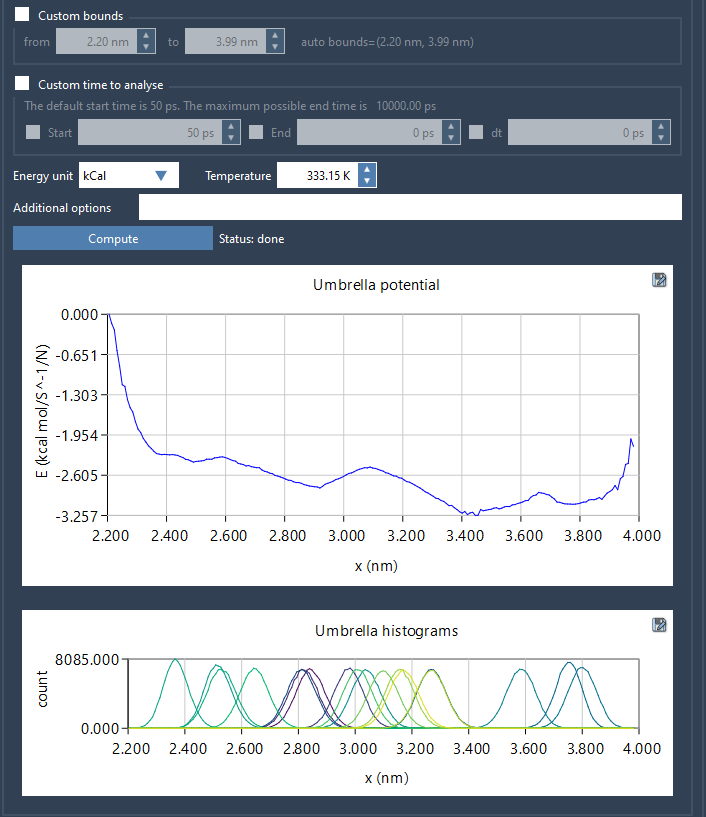
All generated files, including plots, histograms, and profiles, are saved in the wham_results subfolder within your project directory for later reference. Additionally, if you switch between reaction coordinates, the wizard reuses already computed data, saving you computation time.
Next Steps
After analyzing your results, ensure the reaction-coordinate space is adequately sampled. If insufficient sampling appears in specific regions, return to your umbrella sampling workflow and refine simulations in those areas. This iterative approach helps you produce high-quality PMF profiles, delivering reliable insights for your molecular modeling projects.
To dive deeper into the PMF analysis workflow, visit the official documentation page at this link.
SAMSON and all SAMSON Extensions are free for non-commercial use. Get started today by downloading SAMSON at https://www.samson-connect.net.