



For molecular modelers, understanding protein conformations at a deeper level can be a challenge. Fine-tuning design, detecting outliers, or analyzing structural transitions often needs a reliable way to interpret backbone geometry. This is where the Ramachandran analysis in SAMSON’s Path Analyzer becomes a valuable tool. In this blog, we break down the essentials of adding and working with Ramachandran plots to help you seamlessly explore protein conformations.
Why Use a Ramachandran Analysis?
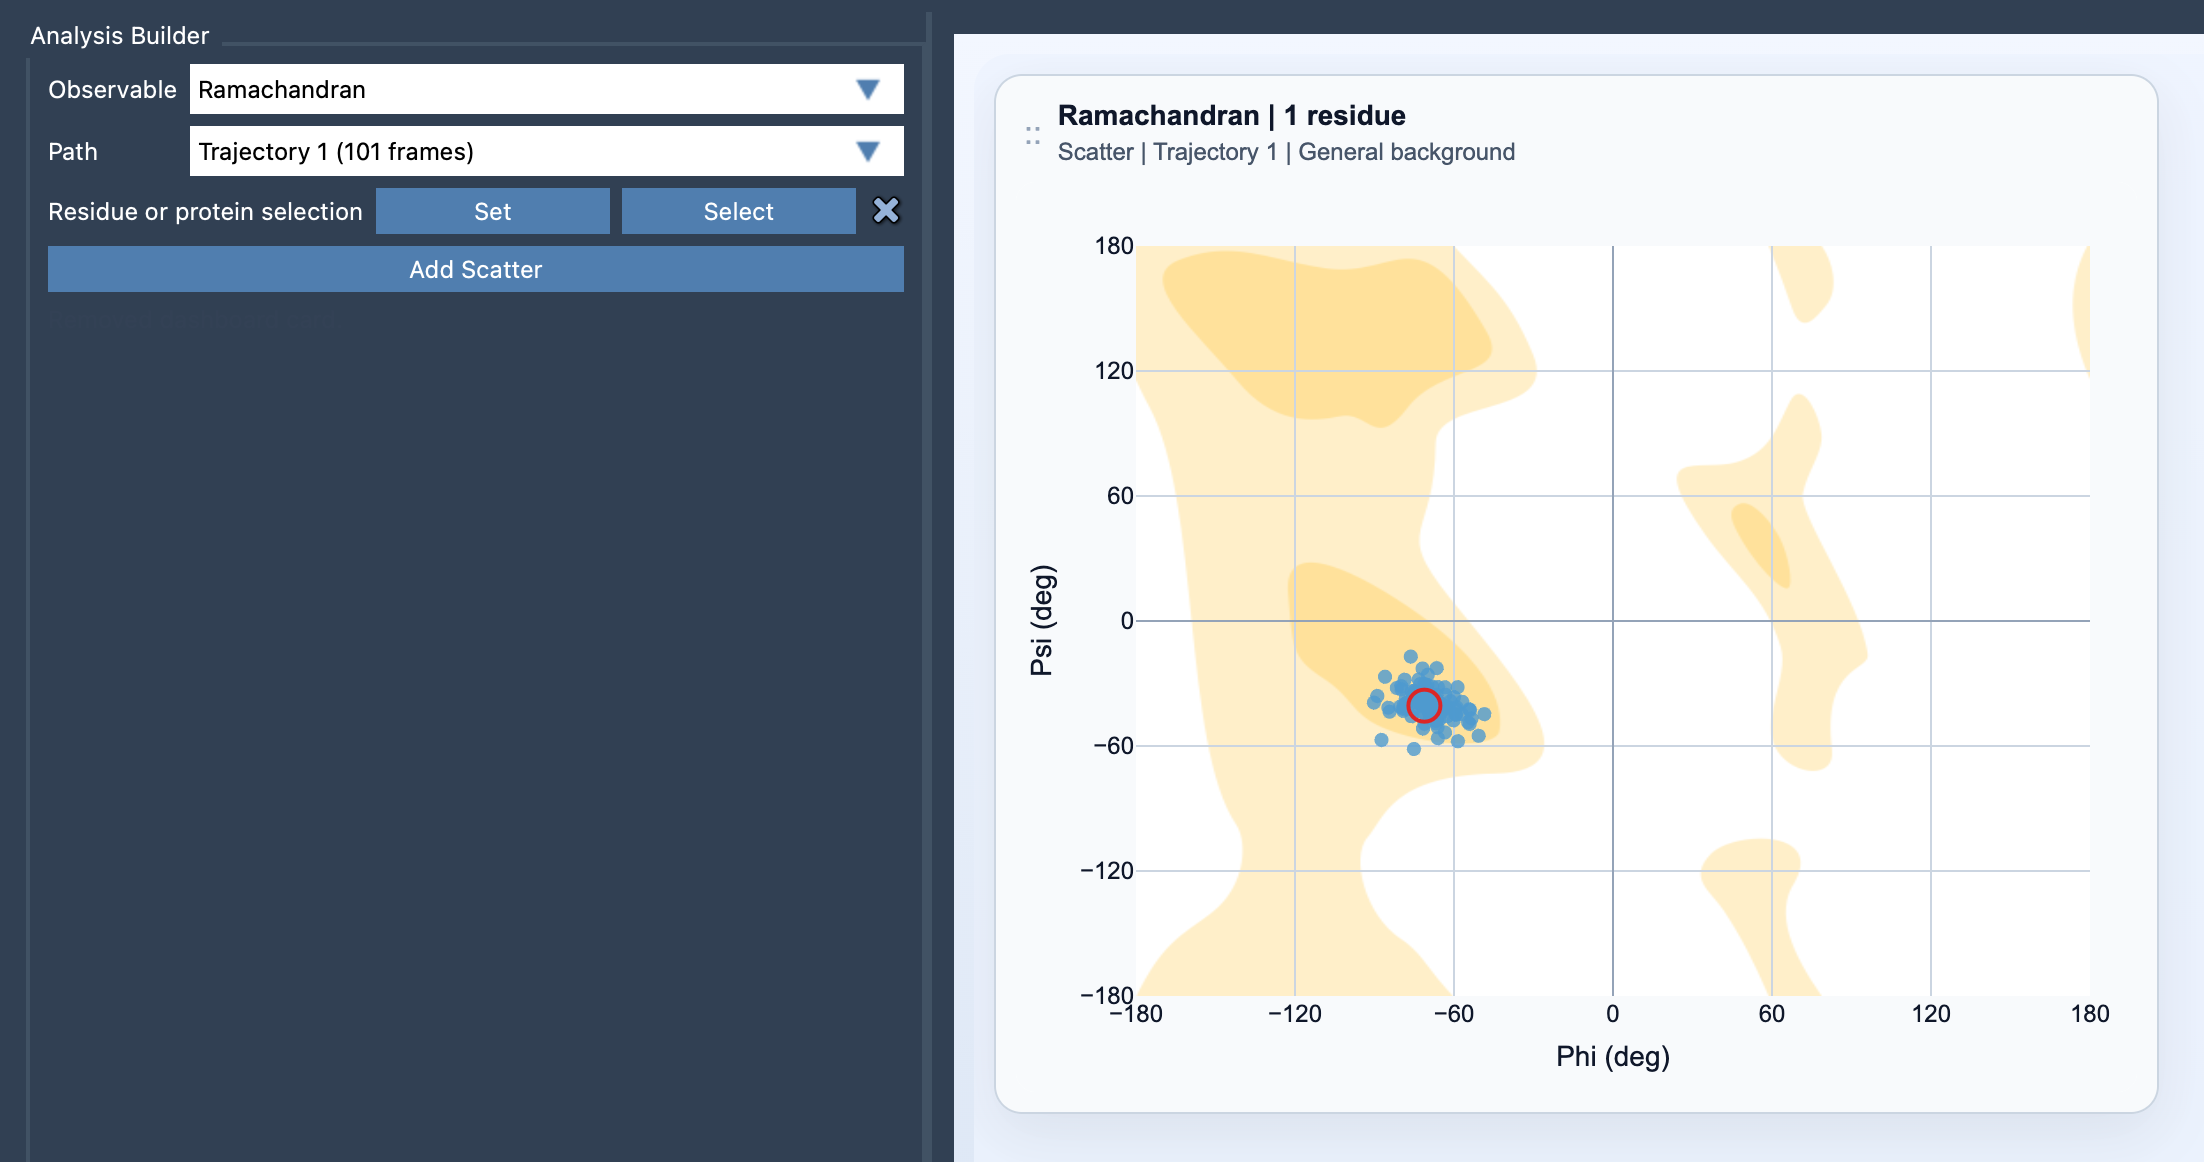
A Ramachandran analysis plots the backbone Φ (phi) and Ψ (psi) angles of protein residues, offering a visual representation of their secondary structures. This makes it an intuitive method for:
- Detecting secondary-structure preferences and transitions.
- Identifying conformational outliers.
- Comparing loop flexibility or structural changes along a conformational path.
Beyond individual use, Ramachandran plots are complementary to other analyses such as secondary structure content and RMSD (Root Mean Square Deviation). Bringing these analyses together offers a cohesive understanding of molecular behavior.
Getting Started: Adding the Ramachandran Plot
Here’s how you can create one:
- Launch the Path Analyzer in SAMSON.
- Set the observable to Ramachandran.
- Select a Path related to your study.
- Define a Residue or protein selection.
- Click Add Scatter to generate your plot.
After this process, the plot helps you decode the underlying conformational information effortlessly by mapping phi values on the x-axis and psi values on the y-axis.
What to Keep in Mind?
To obtain accurate results, it’s important to optimize your dataset and selections:
- Ensure that your selection includes atoms belonging exclusively to protein residues.
- Every valid residue contributes points across the path, offering good coverage of conformational dynamics.
- The built-in background settings adapt automatically for clarity. You can, however, adjust them later in the card settings if needed.
Interactive Insights: Refining Your Exploration
The Ramachandran plot in SAMSON is more than just static data—it enables interaction:
- Single-click on a point to navigate to the corresponding path frame. This efficiently links graphical data to specific conformational states.
- Double-click on a point to highlight the associated residue, aiding residue-specific investigations within the molecular model.
Pro Tips for Productive Analyses
To maximize the utility of your Ramachandran analysis:
- Use a focused residue selection (e.g., a loop, motif, or active site) to study specific structural features.
- For a comprehensive view of conformational sampling, broaden your protein selection.
Leverage the complementary nature of Ramachandran data alongside secondary structure content and RMSD to deepen your understanding of structural behaviors.
Learn more about Ramachandran analysis by visiting the official documentation page.
SAMSON and all SAMSON Extensions are free for non-commercial use. You can download SAMSON at https://www.samson-connect.net.