


When building or refining protein structures, one of the most frustrating tasks is validating whether your backbone conformations are within allowed regions. Outliers in the Ramachandran plot can lead to unstable simulations or questionable structural models, especially in homology modeling or loop refinement. Wouldn’t it help to not only see those outliers easily but also fix them interactively in real time?
The Interactive Ramachandran Plot extension in SAMSON offers a way to explore and edit φ (phi) and ψ (psi) backbone angles directly on the Ramachandran plot — and watch your changes live in 3D.
Instantly Spot Problem Residues
Once installed, launch the Ramachandran plot from your protein structure via Home > Apps > Biology > Ramachandran plot in SAMSON. Click Update to generate the diagram:
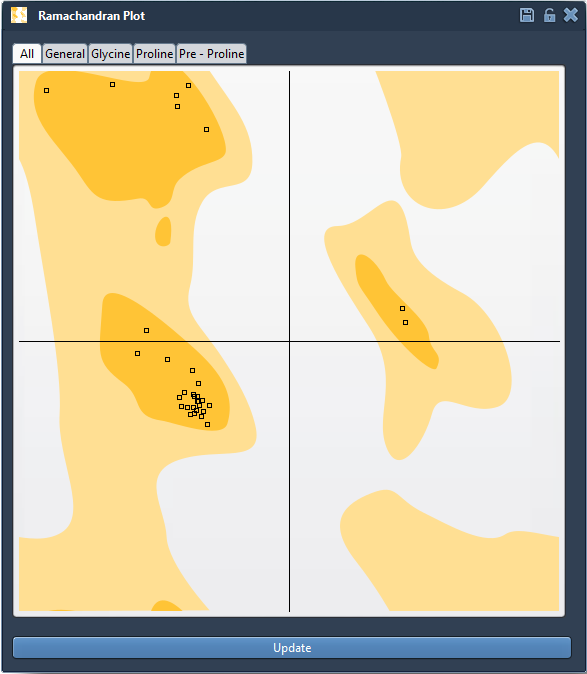
- Yellow regions: favored conformations
- White regions: disallowed conformations
You can filter residues by type: glycine, proline, pre-proline, and other categories. This helps quickly identify special-case residues or focus on general trends.
Select and Explore Residues
Clicking on any point highlights the corresponding residue in the 3D view. You’ll also see its precise φ and ψ values in the status bar:
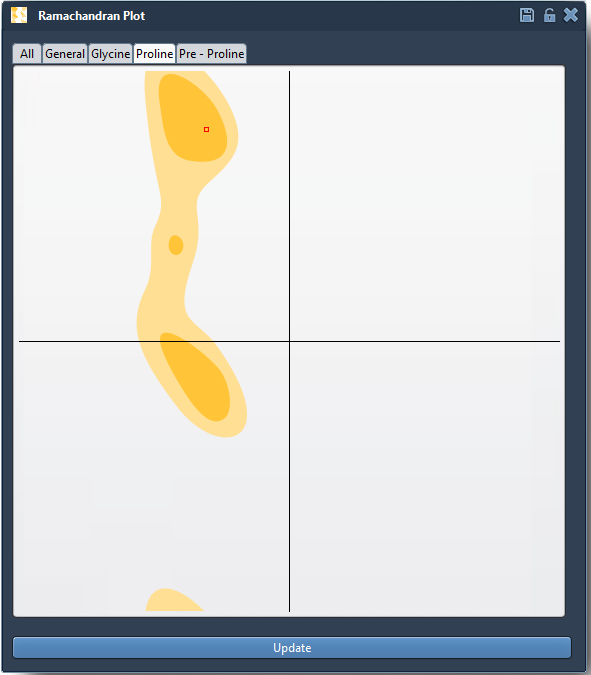

This tight integration between plot and 3D view makes it easy to understand the structural context of every outlier.
Interactive Fixes: Two Ways
Option 1: Drag-and-Drop Editing
Problems with a specific residue? Just drag its point in the plot to more favorable φ/ψ angles. The 3D structure updates in real time:
- Edit backbone conformations directly by moving dots
- Visual feedback immediate in the viewport
- Undo with Ctrl/Cmd + Z if needed
This method is great for small corrections or quickly fixing visible outliers.
Option 2: Twister Editor for 3D Manipulation
Prefer twisting the model in 3D space? Activate the Twister editor from the left-hand toolbar, then adjust the backbone visually. The Ramachandran plot updates automatically:
This approach allows adjusting multiple residues more holistically, watching both the plot and the 3D shape evolve together.
Use Case: Refining Homology Models
In homology modeling, backbone geometry often needs refinement, especially at loops or insertions. With this tool, you can focus on residues in disallowed regions, select them, and interactively reposition them into more plausible areas — all before running any simulation or energy minimization.
Conclusion
The Interactive Ramachandran Plot in SAMSON bridges the gap between validation and model correction. Whether you are checking a manually built model, refining a homology prediction, or just exploring protein flexibility, this interactive plot can save time and provide insight.
👉 Learn more in the full documentation page
SAMSON and all SAMSON Extensions are free for non-commercial use. You can get SAMSON at https://www.samson-connect.net.