One common challenge in molecular simulations is determining whether you’ve sampled enough along the reaction coordinate during umbrella sampling. Incomplete coverage can lead to artifacts in the computed free energy profiles, making them unreliable. If you’ve ever spent days running simulations only to discover gaps in your data later, you’re not alone.
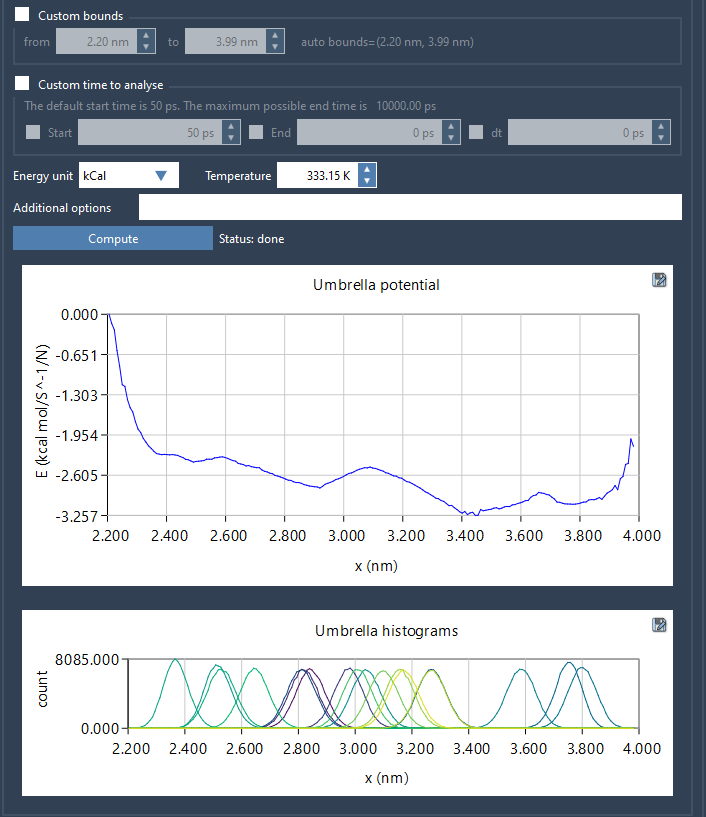
Fortunately, the GROMACS Wizard in SAMSON offers a helpful feature as part of its WHAM (Weighted Histogram Analysis Method) analysis: a histogram that visualizes how well your simulation covers the reaction coordinate space.
Why coverage matters
PMF (Potential of Mean Force) profiles are only as good as the data behind them. During umbrella sampling, you generate multiple simulations, each centered around a different value of the reaction coordinate. If there’s insufficient overlap or missing sampling in key regions, WHAM won’t be able to stitch together a reliable profile.
This is especially problematic if you are studying protein-ligand dissociation, conformational changes, or any process where sampling bias can go unnoticed until late in the analysis stage.
A simple visualization tool
After your umbrella sampling simulations are complete and organized in numbered subfolders (each corresponding to a window along the reaction coordinate), move to the WHAM Analysis tab in the GROMACS Wizard.
The process is straightforward:
- Select the project folder or use the auto-fill button to retrieve the path used in the previous step.
- Choose your reaction coordinate and modify options like bounds or time if needed.
- Click Compute to generate your PMF profile and the corresponding histogram.
The resulting histogram is often overlooked, but it provides valuable insight. It highlights how densely (or sparsely) each region of the reaction coordinate was sampled. Peaks indicate where many frames were simulated, while valleys suggest regions where your simulations might be lacking. Here’s what it looks like:

If you see uneven coverage, consider refining those sampling zones. This might mean running new simulations with narrower spacing between umbrella windows, increasing simulation time in specific regions, or using adaptive sampling strategies.
When time matters
Processing large datasets can take time—sometimes a few minutes. The GROMACS Wizard helps by caching previously computed data. Once the computation is done for specific parameters, the results are stored in a wham_results subfolder within your project. So if you change the reaction coordinate or switch back and forth, the software simply loads the existing results if nothing has changed, saving you valuable time.
Conclusion
If you’re performing PMF calculations with umbrella sampling, don’t skip this step. A quick glance at the histogram lets you evaluate the robustness of your sampling and determine if further simulations are needed. It’s a simple habit that can lead to much higher-quality results.
You can learn more about this workflow in the official documentation: GROMACS Wizard – PMF Analysis.
SAMSON and all SAMSON Extensions are free for non-commercial use. You can get SAMSON at https://www.samson-connect.net.


