Tracking how ligands unbind from biomolecules is critical for understanding molecular interactions — but visualizing this process across a simulation trajectory can be tricky. A common struggle among molecular modelers is identifying and presenting meaningful movement without overwhelming the viewer with raw data or frames.
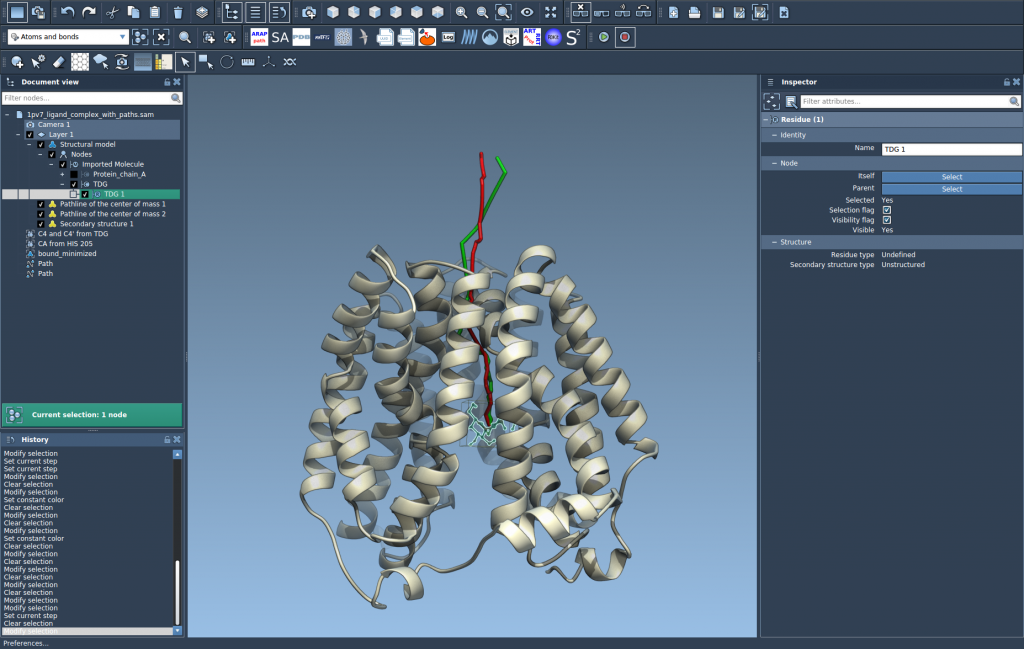
Pathlines in SAMSON offer a simple way to visualize the motion of a group of atoms — such as a ligand — by plotting the displacement of their center of mass (COM) along a path. Rather than watching an entire animation, you get an elegant line representing the motion in 3D space over time.
Here’s a practical walkthrough on how to achieve this: a useful tool for studying ligand unbinding routes or conformational transitions.
Step 1: Load the Sample System
You can begin by loading a working example. This sample contains Lactose Permease (1PV7), a bound ligand (Thiodigalactosid, TDG), and predefined unbinding paths generated using the Ligand Path Finder extension.
To load the system in SAMSON:
- Click Home > Download.
- Paste the sample document URL:
https://www.samson-connect.net/documents/046f1acd-c799-40f6-8185-cb4847eff795 - Click Download.

Step 2: Select the Atoms and Paths
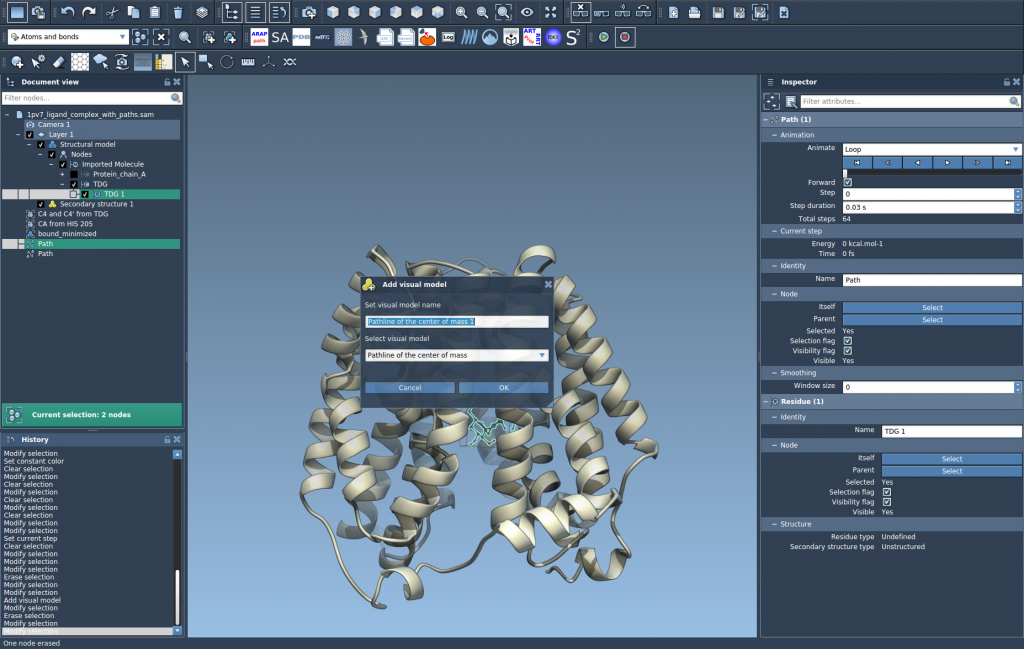
In the Document view, select a group of atoms you want to track — for example, the ligand TDG — and one or more paths. You can use Ctrl (or Cmd on macOS) for multiple selections. If you skip selection, SAMSON will use all available atoms and paths by default.

Step 3: Create a Pathline Visual Model
To generate a COM pathline trajectory:
- Go to Visualization > Visual model > More…, or use the shortcut Ctrl/Cmd + Shift + V.
- Select Pathline of the center of mass and press OK.

The result is a single, clear line representing the overall direction and extent of the selected atoms’ movement.

Step 4: Customize and Analyze
You can personalize the pathline by:
- Double-clicking a path in Document view to play or pause.
- Accessing context menu options by right-clicking the path.
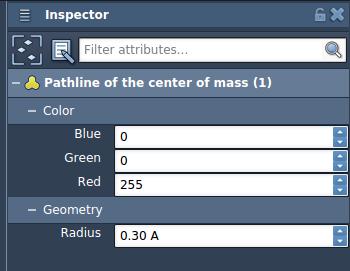
- Using the Inspector (Ctrl/Cmd+2) to adjust visual properties like color and thickness.

You can use pathlines to:
- Visualize ligand unbinding or rebinding paths.
- Analyze domain motions in proteins.
- Summarize long trajectories efficiently for presentations or publication figures.
This approach is lightweight yet informative, allowing you to see the forest without getting lost in the trees.
To learn more, visit the original documentation page:
https://documentation.samson-connect.net/tutorials/pathlines/pathlines/
SAMSON and all SAMSON Extensions are free for non-commercial use. You can download SAMSON from samson-connect.net.


