



Understanding molecular interactions and their dynamics can be a complex task. Whether you’re studying binding events, protein interfaces, or domain interactions, accurately tracking how features come into contact is essential for molecular modeling. This is where the Contacts analysis tool in SAMSON’s Path Analyzer becomes an invaluable asset.
The Contacts analysis is designed to help molecular modelers visually and computationally track how feature pairs are in contact across time. With intuitive visualizations like contact series and contact maps, the tool provides a clear picture of how interactions evolve in your system. Here’s how these tools can address key challenges in molecular modeling:
Spot Interaction Dynamics with Contact Series
The contact series visualization tracks the total number of contacts across frames over time. This makes it straightforward to quantify when a specific molecular interface forms or breaks. For instance, if you’re modeling a protein-ligand docking process, a spike or drop in the contact series graph can indicate the precise frame where binding or unbinding occurs.
As a molecular modeler, this insight allows you to focus your analysis on crucial regions of your simulation, saving you the time and effort of manually inspecting each frame.
Map Individual Residue Interactions with Contact Maps
If you want to zero in on the specific features responsible for interactions, the contact map is your go-to tool. The map provides a heatmap-like summary of each feature pair’s occupancy across the entire path of your simulation. This allows for granular analysis and helps identify which residues, domains, or ligands are key contributors to the interaction.
For example, if you’re studying conformational changes in a receptor, the contact map can reveal which domains consistently interact, offering insights into structural stability and binding mechanisms.
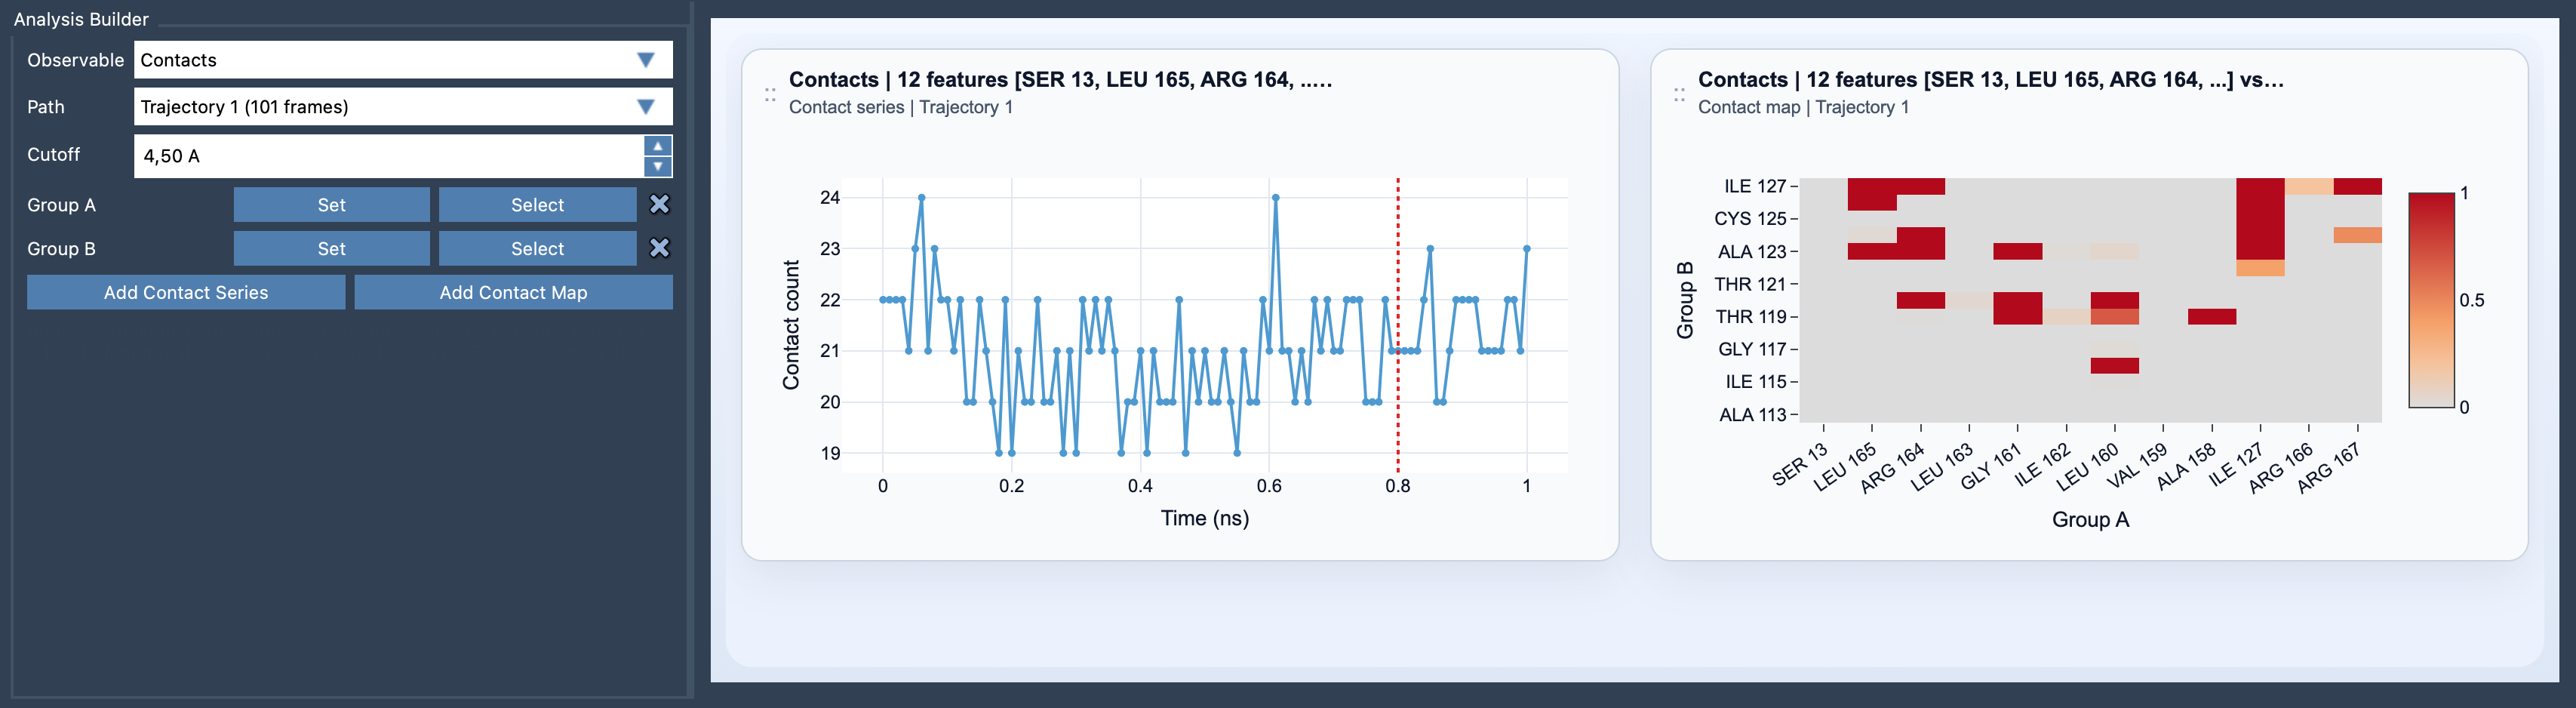
Getting Started with Contacts Analysis
Adding a contact plot in SAMSON is straightforward:
- Open the Path Analyzer.
- Select Contacts under Observable.
- Define two groups: Group A and Group B.
- Set the desired contact cutoff value.
- Add either a Contact Series or Contact Map to your analysis.
The cutoff, defined in angstroms (A), helps refine the analysis by limiting which pairs of features are considered “in contact.” Choosing suitable root selections (e.g., residues, ligands, chains) ensures that the map is easy to interpret and actionable.
Combine Insights from Both Views
For a complete understanding of molecular interactions, use both the contact series and contact map together. While the series helps identify when interactions form or break during your simulation, the map pinpoints the specific features responsible for these changes. This dual perspective can prove especially useful in complex systems where multiple processes occur simultaneously.
Extend Your Analysis
If you’re working on long trajectories and need detailed contact persistence information, SAMSON also offers a dedicated Contact Persistence tool. This provides the full binary time history of each contact pair for even deeper insights.
To learn more about the Contacts analysis in SAMSON, visit the official documentation page.
SAMSON and all SAMSON Extensions are free for non-commercial use. You can get SAMSON at www.samson-connect.net.