



As a molecular modeler, understanding protein conformations is often crucial. Whether you’re studying secondary-structure preferences, investigating conformational outliers, or analyzing backbone transitions, it can be challenging to efficiently connect structural insights with meaningful data points. The solution? The Ramachandran plot in SAMSON’s Path Analyzer tool.
What is the Ramachandran Plot?
The Ramachandran plot visualizes protein backbone conformations in phi/psi space. In other words, it maps torsion angles of protein residues, offering insights into secondary-structure stability, unusual residue behavior, or even structural transitions within your protein of interest. This plot is essential for protein analysis workflows, providing immediate clarity on conformational sampling.
How Do You Create a Ramachandran Plot in SAMSON?
The process of setting up a Ramachandran plot in SAMSON is designed to be user-friendly. Here are the steps:
- Open the Path Analyzer tool within SAMSON.
- Select “Ramachandran” from the list of available observables.
- Choose the path you wish to analyze.
- Define your selection—this could range from a specific residue, a loop, or even the entire protein, depending on your focus.
- Click the “Add Scatter” button to generate the plot.
Each residue contributes a phi/psi point for every step along the path, visualizing its distribution and sampling. By default, Path Analyzer selects a background for the plot (commonly, allowed/disallowed regions), but this can be customized later to fit specific needs.
Interpreting the Plot
The Ramachandran plot in SAMSON allows for seamless interaction and interpretation:
- Scatter View: Each protein residue’s phi angle is plotted on the x-axis, while the psi angle is on the y-axis. This provides immediate context on conformational preferences.
- Click Interaction: Clicking a specific point in the plot moves your active path to the corresponding frame, letting you directly visualize the structural state of the protein at that moment.
- Double-Click Interaction: Double-clicking a point selects the associated residue(s) within SAMSON, so you can explore finer details such as atomic environments or structural neighbors.
Focused Insights for Your Workflow
The Ramachandran plot in SAMSON is flexible enough to address specific research needs:
- If you’re focused on a single loop, motif, or active site, define a targeted residue selection to hone in on its conformational preferences.
- For global insights into protein dynamics, use a broader residue or protein-wide selection to visualize the overall sampling of backbone torsion angles.
Combine the insights from the Ramachandran plot with complementary tools in SAMSON, such as Secondary Structure Content or Root Mean Square Deviation (RMSD) analyses. Together, they create a more comprehensive picture of your protein’s behavior.
See It in Action
Below is an example of the Ramachandran plot generated in SAMSON:
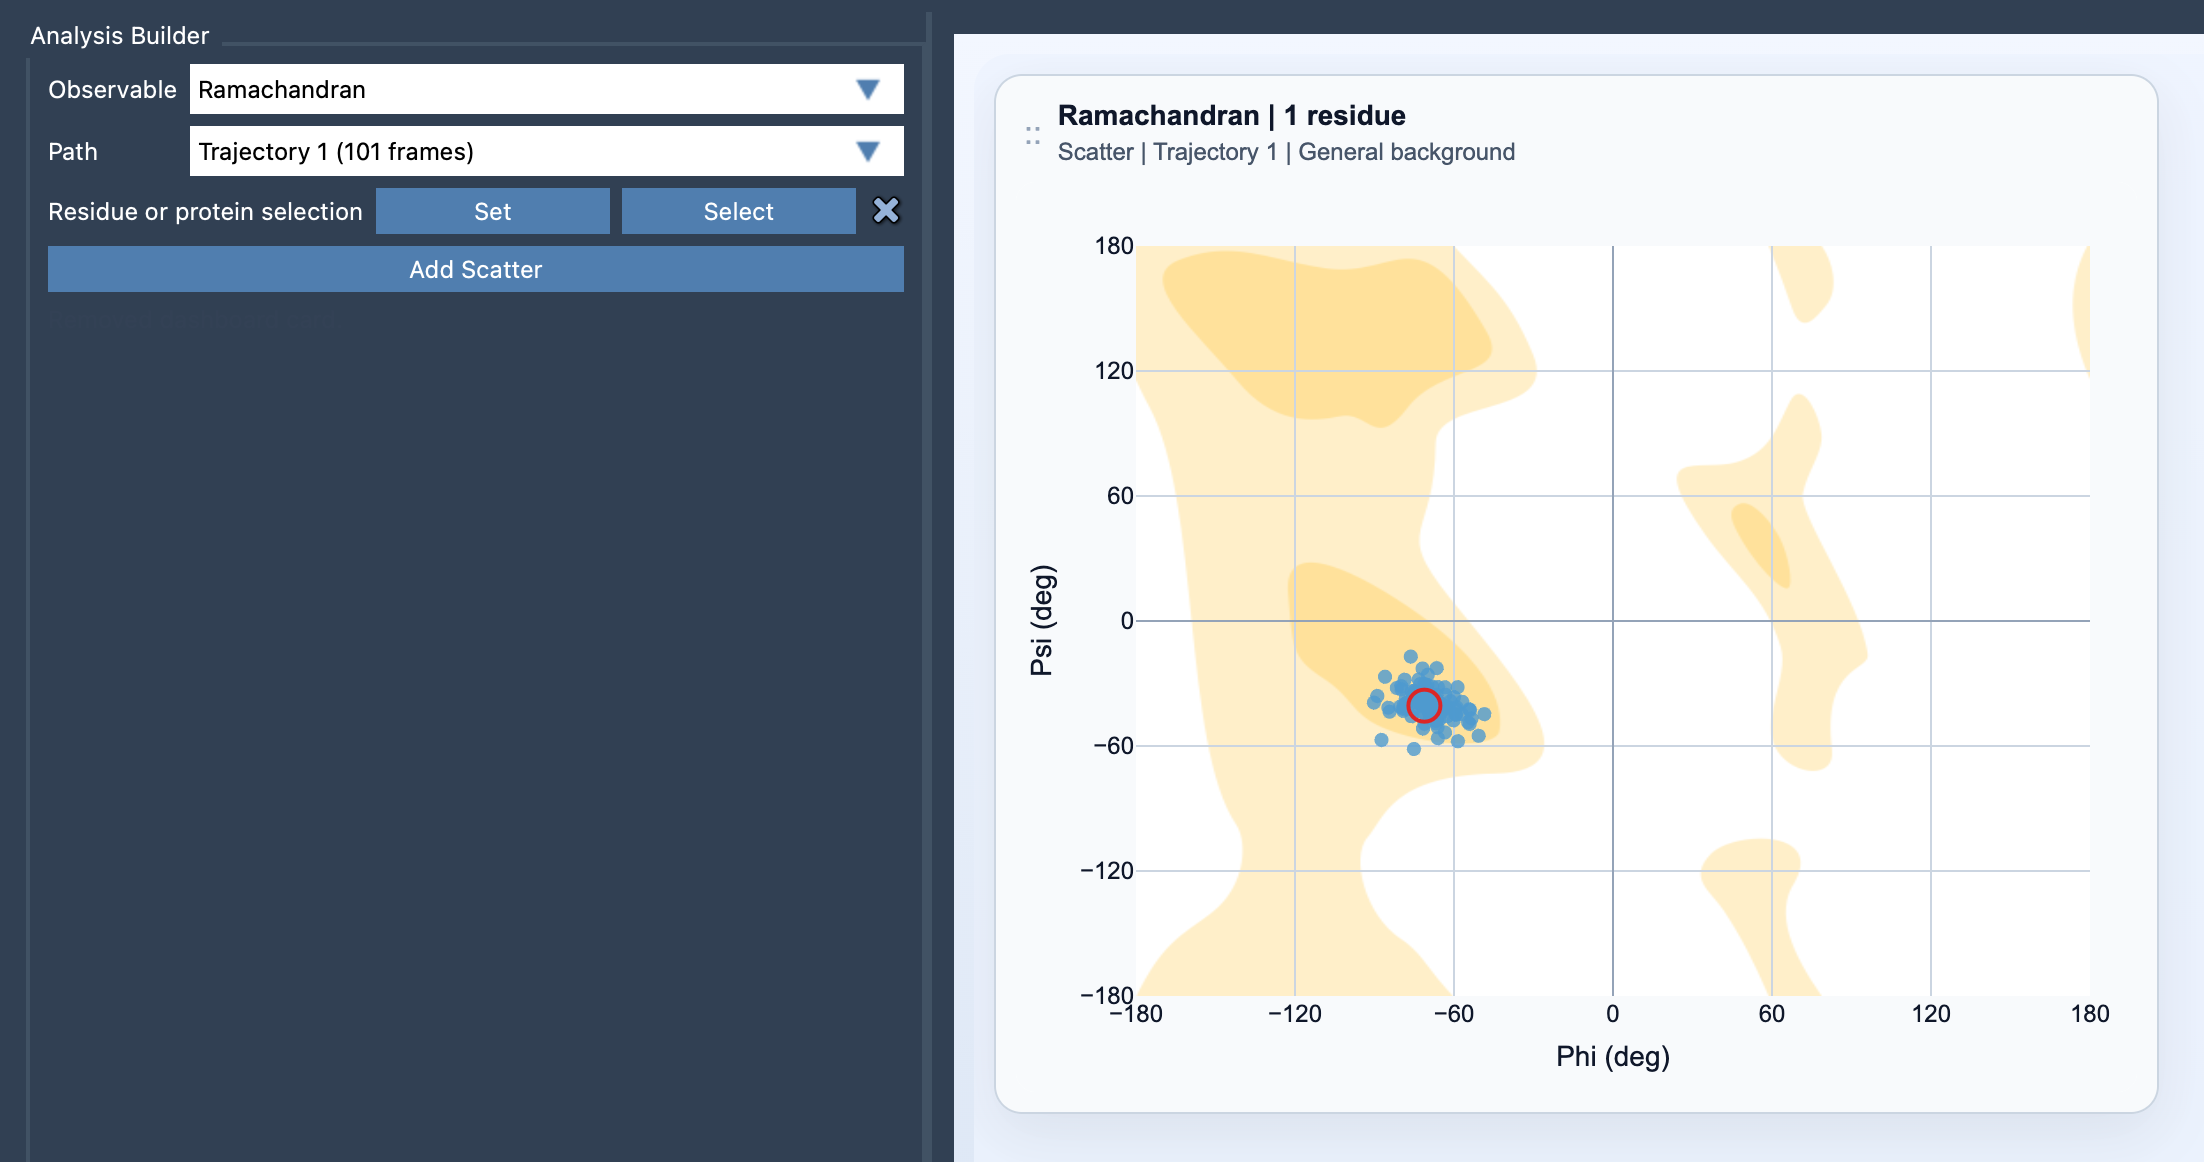
Torsion angles are precisely mapped, and the customizable visual background ensures your data is easy to interpret.
Learn more about the Ramachandran plot in SAMSON’s documentation page.
Note: SAMSON and all SAMSON Extensions are free for non-commercial use. Download SAMSON today at SAMSON-Connect.