



Tracking changes in the secondary structure of proteins can often feel like navigating a maze. Whether you’re monitoring how alpha helices develop or observing a transition to unstructured forms, having the right tools to break down protein backbone dynamics is crucial for molecular modelers. This is where the Secondary Structure Content analysis tool in SAMSON’s Path Analyzer comes in.
The Secondary Structure Content analysis provides a high-level summary to monitor backbone structure changes over time. It numerically quantifies the relative presence of alpha helices, beta sheets, and unstructured regions in protein models at every frame during a simulation. This is especially valuable for studying structural stability, ligand interactions, or conformational changes in proteins undergoing dynamic processes.
How to Add the Plot
Creating and customizing this analysis in SAMSON is straightforward. Follow these steps to get started:
- Open the Path Analyzer in SAMSON.
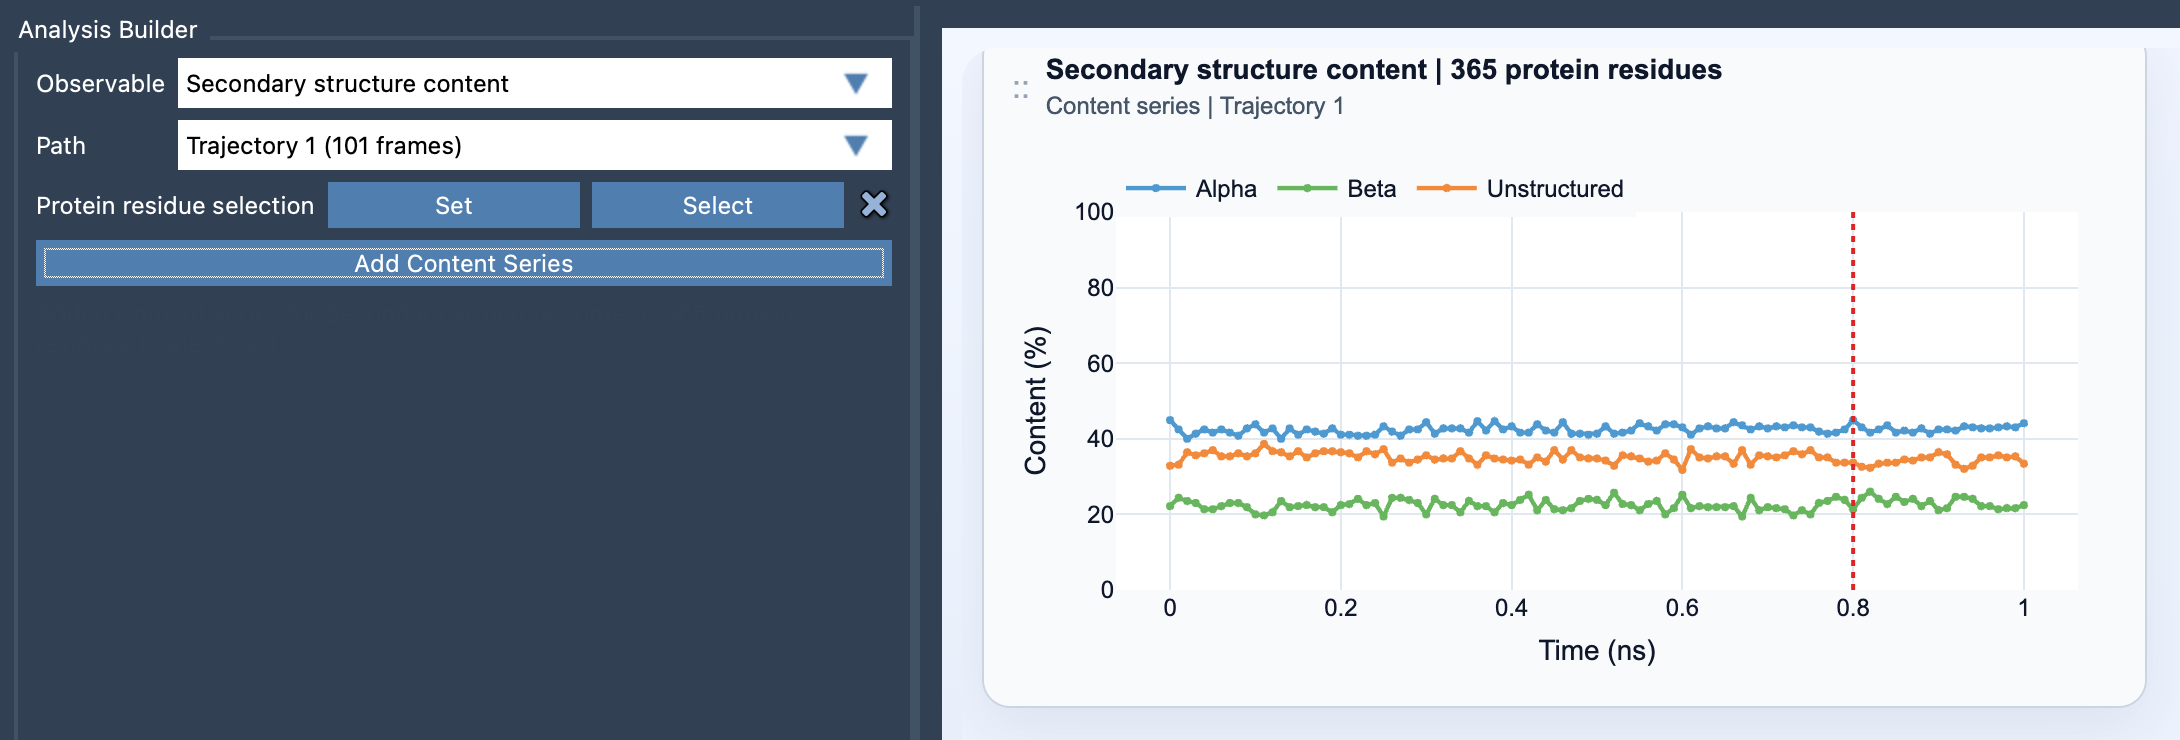
- Select Secondary structure content under the Observable menu.
- Pick the Path that describes your simulation trajectory.
- Define your Protein residue selection, such as the entire protein chain or specific domains.
- Click on Add Content Series. A clear, multi-series time plot is instantly generated.
Understanding the Visualization: Why It Matters
The visualization generated is a multi-series time plot. Each curve represents the evolution of the percentage of protein residues in alpha, beta, or unstructured states throughout the simulation. The values range between 0 and 100 %, making it easy to understand and interpret.
This kind of overview allows you to:
- Spot Trends: Detect regions of the protein shifting from beta sheets to unstructured forms, for instance.
- Isolate Features: Focus on specific domains, helix regions, or loops when studying localized conformational changes.
- Verify Stability: Confirm whether a protein maintains its secondary structure throughout a simulation.
Tips for Tailoring Your Analysis
You can adapt your approach to the analysis depending on what specific features you’re trying to understand:
- Use broad selections if your goal is to assess the secondary structure across the entire protein.
- For more detailed analysis, narrow your selection to isolated regions like domains or loop-rich areas.
- Combine this analysis with the Ramachandran plot for deeper insights into backbone conformations.
Using Secondary Structure Analysis for Maximum Impact
The quantification method behind the tool is based on computing percentages for alpha, beta, and unstructured residues at each frame:
This mathematical approach provides precise and intuitive metrics, allowing you to draw actionable conclusions about protein dynamics. For instance, you could observe whether a protein catalytically relevant helix maintains its integrity or if a beta-sheet-rich region adapts for interaction with another molecule.
In short, SAMSON’s Secondary Structure Content tool empowers molecular modelers to identify meaningful changes rapidly and efficiently, saving time while offering high accuracy.
To dive deeper into the specifics of this feature, visit the original documentation page here.
SAMSON and all SAMSON Extensions are free for non-commercial use. You can get SAMSON here and jumpstart your molecular modeling today!