



Protein dynamics play a crucial role in understanding biological functions, and monitoring changes in secondary structure over time is often a key step for molecular modelers. Tracking percentages of alpha helices, beta sheets, and unstructured regions can offer a high-level summary of backbone configurations across different frames of a simulation. This blog post provides an overview on how SAMSON’s Path Analyzer enables scientists to effortlessly visualize and quantify protein secondary structure content.
Why Monitor Secondary Structure Content?
Imagine studying a protein undergoing complex transformations, such as unfolding, refolding, or domain movement. This can be overwhelming without proper tools to break down the complexity. Monitoring secondary structure percentages over time allows researchers to:
- Identify structural transitions (e.g., helix-to-coil transitions).
- Compare stability across different conditions or mutations.
- Zoom in on collective behaviors in specific domains or regions.
Using SAMSON’s Path Analyzer, gaining these insights becomes intuitive and visually engaging.
Adding the Secondary Structure Content Plot
The process to set up the plot in SAMSON is quick and straightforward. Here’s what you need to do:
- Open the Path Analyzer in the SAMSON integrative platform.
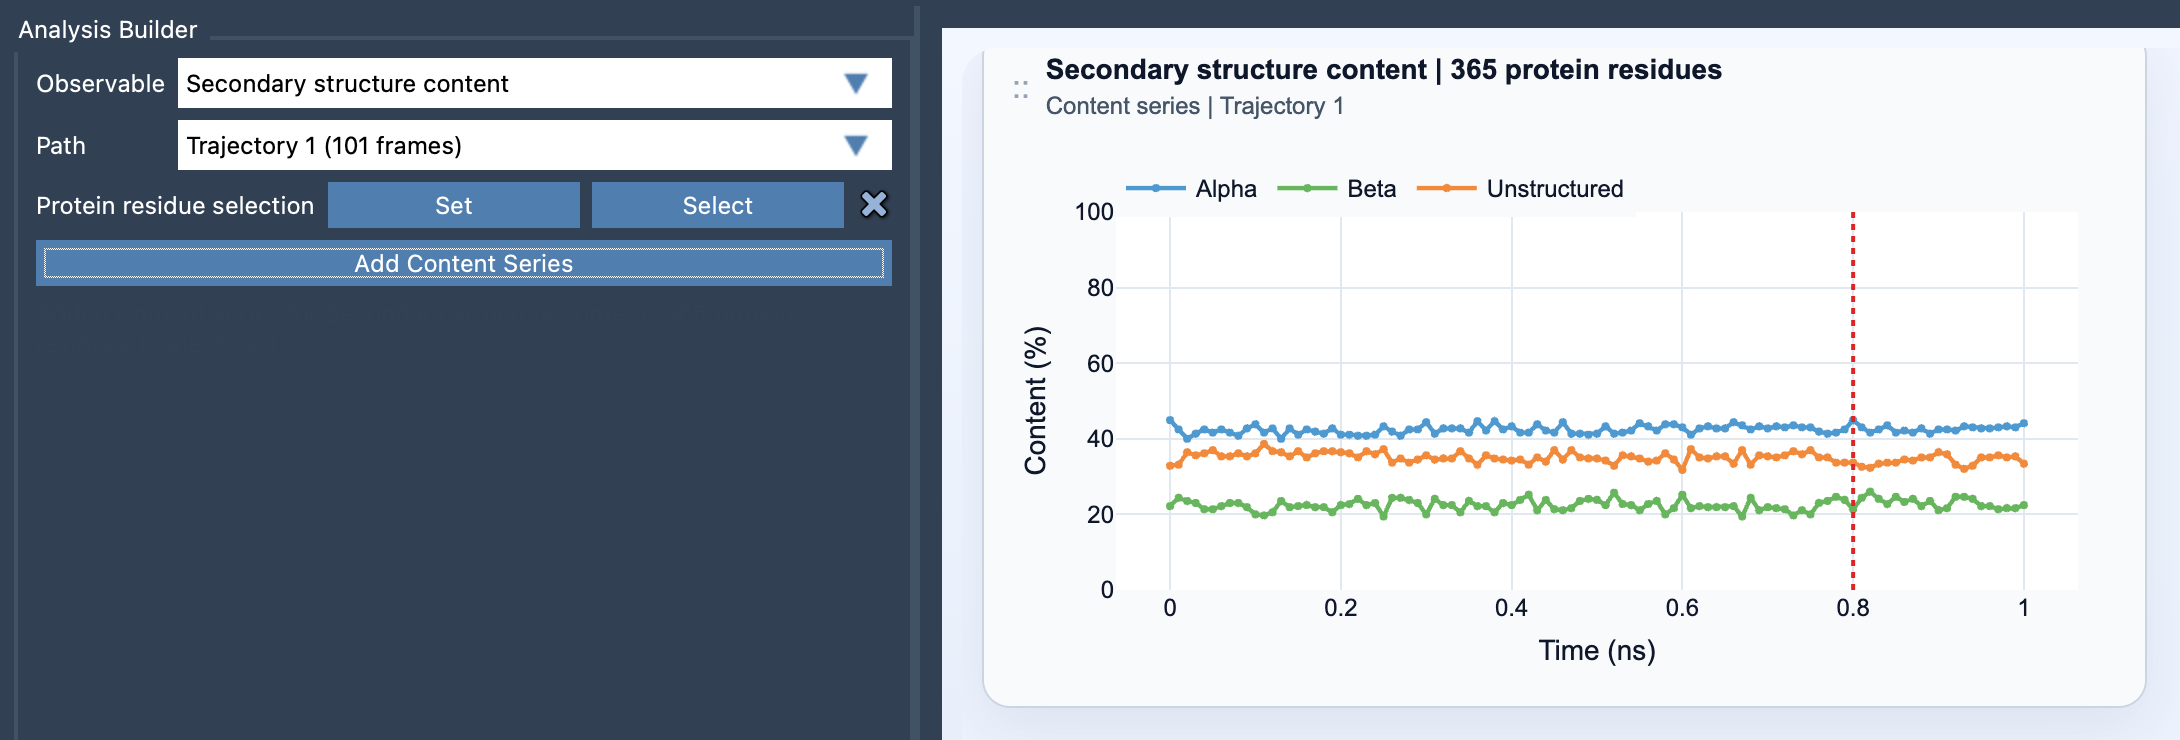
- Select Secondary structure content in the Observable options.
- Choose the Path for your simulation data.
- Define a Protein residue selection. This can cover all residues for a bird’s-eye view or focus on specific regions (like domain interfaces or beta-sheet regions).
- Click Add Content Series to generate the secondary structure percentage over time plot.
How It’s Displayed
The result is a multi-series time plot, where each series corresponds to a fraction of the protein in alpha, beta, or unstructured conformations. Values range from 0 to 100%, with changes plotted over the selected frames. This visualization enables easy identification of trends and anomalies in the data.
Tips for Best Results
- Broad selections are ideal to capture overall secondary structure trends across the entire protein, which can reveal global folding or unfolding events.
- Focused selections enable detailed analysis of specific regions, such as helix bundles, active sites, or loop-rich regions undergoing significant changes.
- For deeper insight, combine this plot with the Ramachandran plot to assess both global trends and residue-level details of secondary structure.
Learn More
By offering quantitative tracking and easy visualization of secondary structure transitions over time, SAMSON’s Path Analyzer equips molecular modelers with reliable tools for dissecting protein dynamics. To dive deeper into the details of this feature, visit the full documentation page here.
Note: SAMSON and all SAMSON Extensions are free for non-commercial use. You can get SAMSON at https://www.samson-connect.net.