For molecular modelers studying viral infection mechanisms, visualizing large structural transitions can be challenging. One of the most important examples in recent years is the opening motion of the SARS-CoV-2 spike, a prerequisite for the virus to bind to human cells via the ACE2 receptor.
In many studies, researchers refer to the spike protein as being in either a “closed” or “open” conformation—terms which are easy enough to understand conceptually, but far harder to visualize and represent accurately in molecular modeling. Fortunately, SAMSON, an integrative platform for molecular design, offers a practical and visual solution.
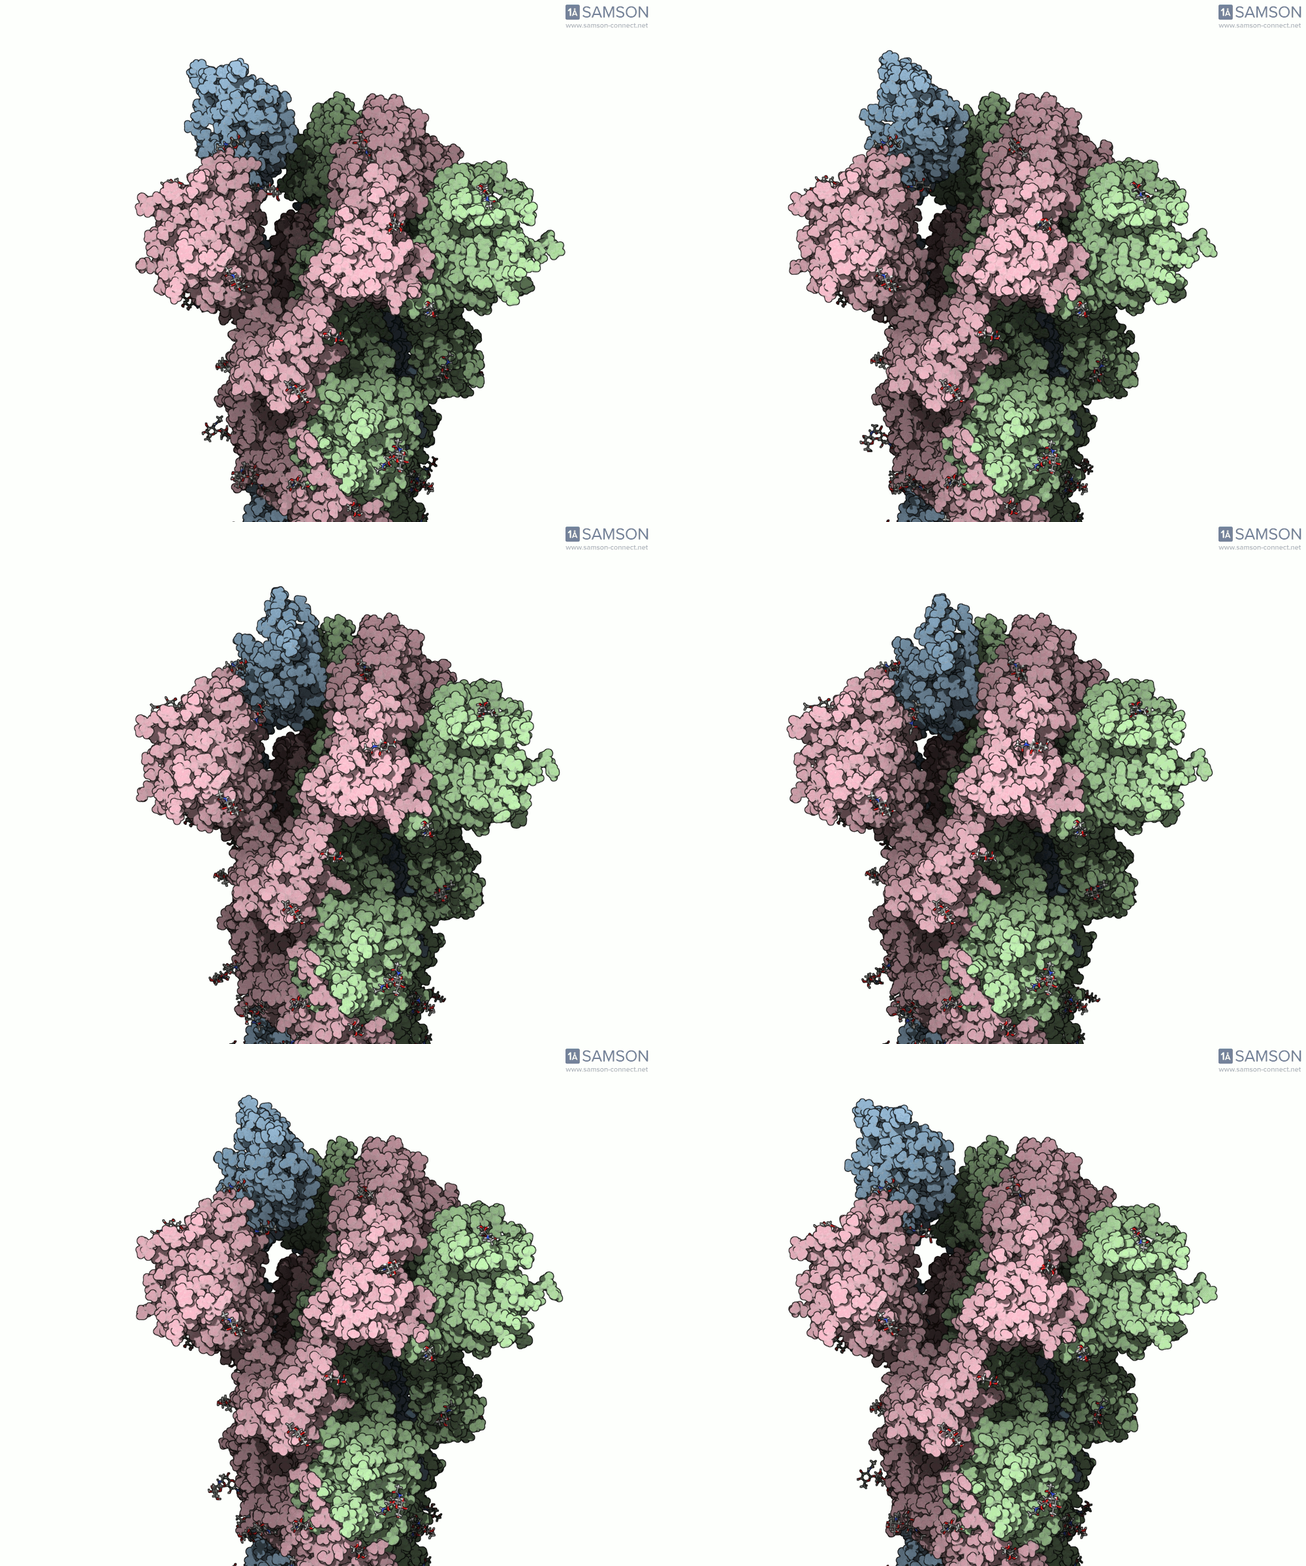
Instead of relying on static snapshots alone (e.g., PDB 6VXX for closed, 6VYB for open), with SAMSON you can explore the interpolated motion between these two biologically significant states. The generated trajectory isn’t just a visual aid — it can be a starting point for further simulations, mechanistic insights, or even educational animations.
Why this matters
Understanding dynamic molecular behavior is at the core of drug design. When structures shift subtly or significantly between states, binding pockets may appear and disappear, or become more (or less) accessible. That’s precisely why animations of the spike opening help researchers think about antibody design, binding inhibition, or vaccine targeting.
Ready-made trajectories
Using SAMSON, a combination of the ARAP Interpolation Path module and the P-NEB module was used to compute the transformation between the closed and open spike states. The result? Downloadable, smooth trajectories in multiple formats (individual PDBs, combined trajectory PDB, SAMSON format).

Side view of the SARS-CoV-2 spike transitioning from closed to open state
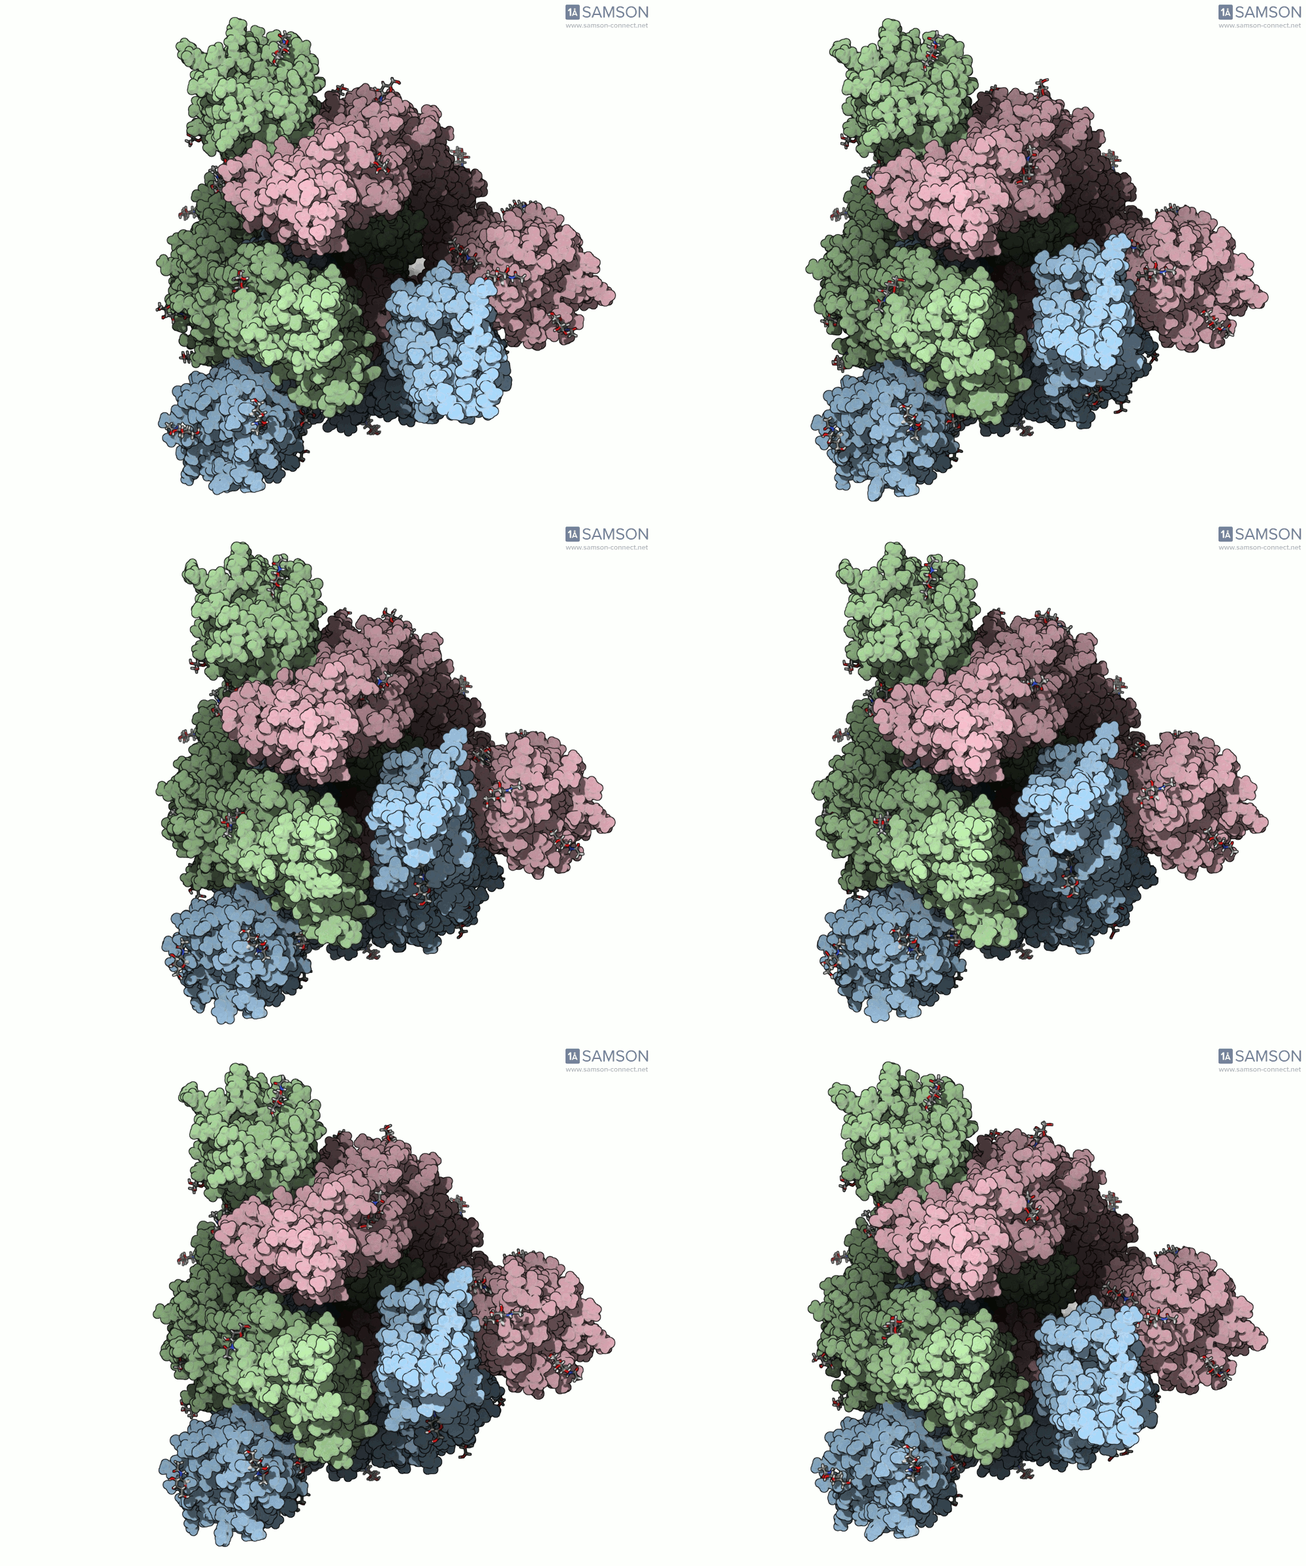
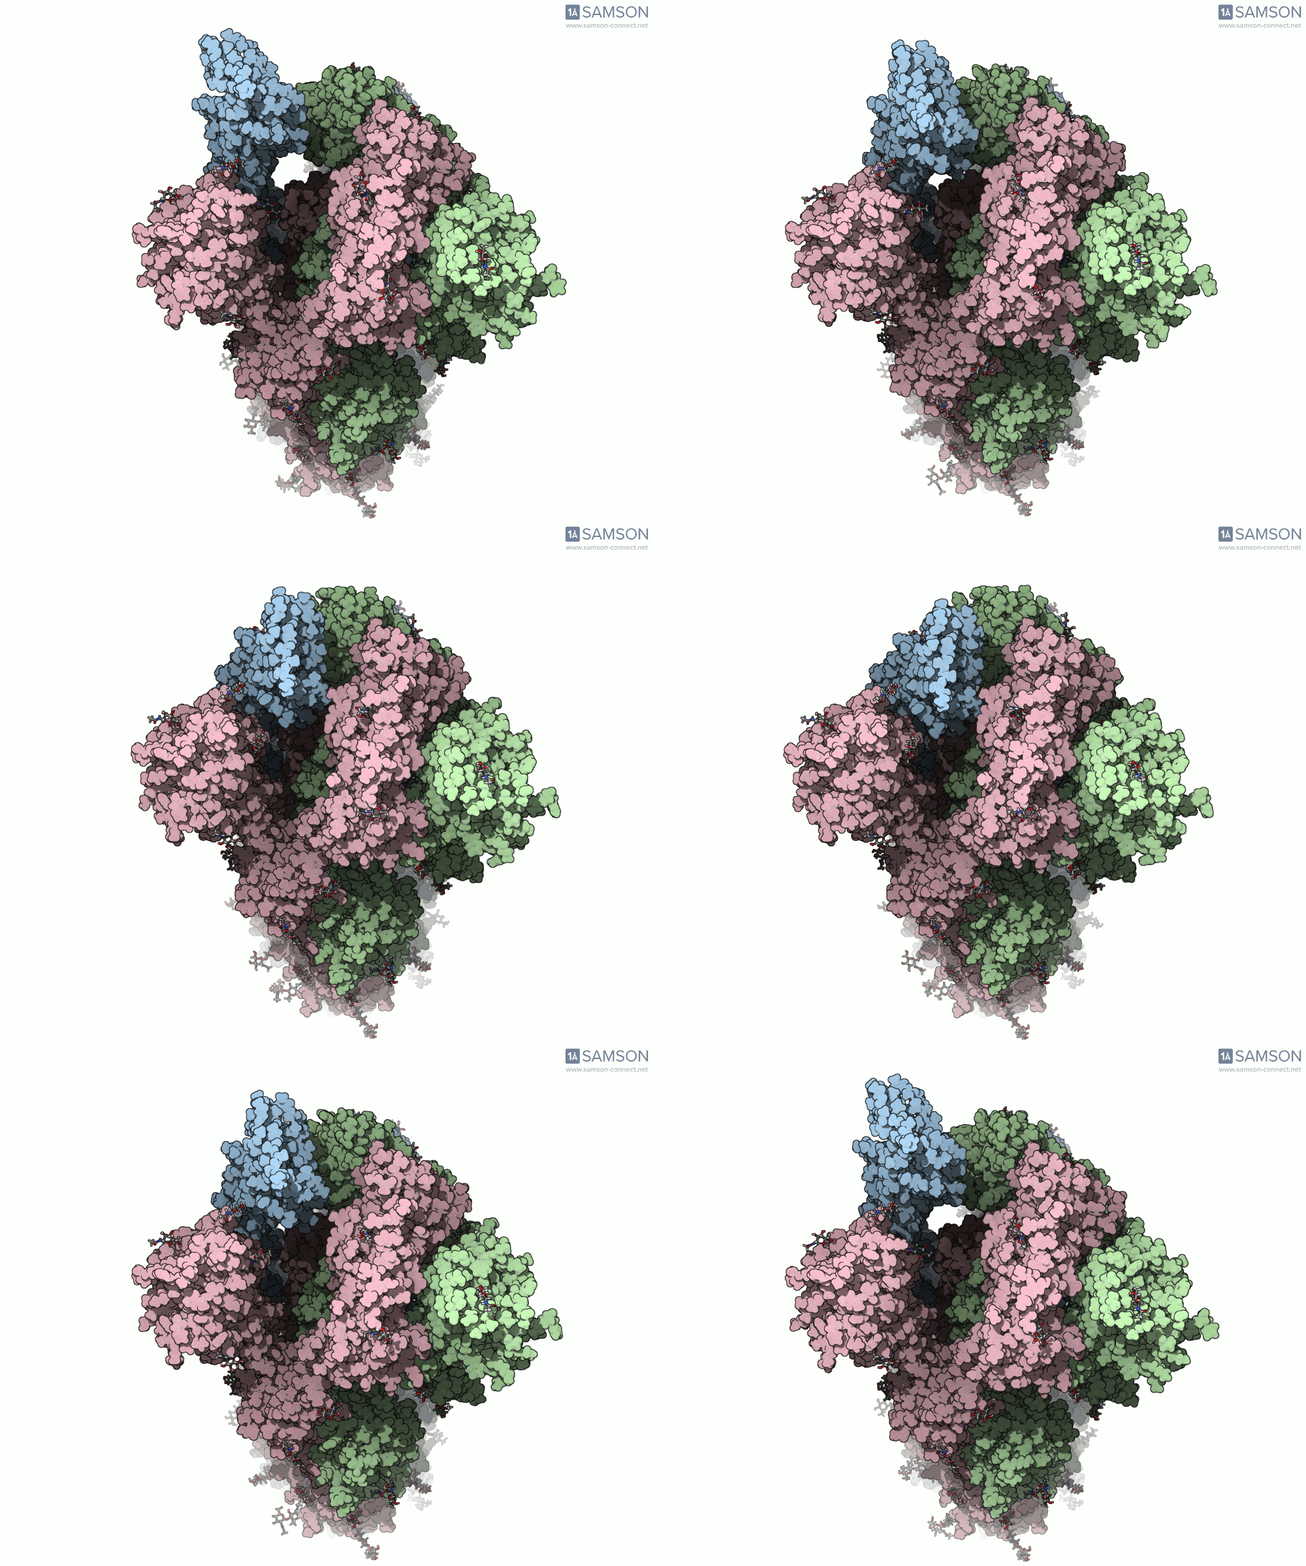
Here are a few more perspectives:
These animations not only help with structural insight but also can enhance visual communication — for research talks, outreach, or collaborative discussions.
How it was done
The SAMSON documentation details the procedure used to generate these transitions. Starting with PDB 6VXX and 6VYB (which differ in more than just conformation — some residues are missing in one versus the other), the structures were preprocessed with bond corrections and hydrogen additions. Then, ARAP generated an initial interpolation, and P-NEB refined the transition path to be more physically meaningful.
Each computed conformation remains chemically coherent − an especially valuable property when trajectories will be used for further calculations or hypothesis testing.

The computed trajectory visualized inside the SAMSON Document view
Download and explore
The trajectories are made available under the Creative Commons CC BY 4.0 license and can be freely downloaded from the documentation page. The file is offered in three variants:
By studying this structural transition, you can better understand how SARS-CoV-2 initiates infection at the molecular level — and what makes this virus especially efficient at cellular entry.
To dive deeper into every step of trajectory computation and to explore the underlying methodology based on PDB 6VXX and 6VYB, visit the original documentation page: Visualizing SARS-CoV-2 spike motion.
SAMSON and all SAMSON Extensions are free for non-commercial use. You can get SAMSON and start exploring molecular trajectories at https://www.samson-connect.net.


