



A Potential of Mean Force (PMF) curve can look polished and still leave an important question unanswered: did the simulations adequately sample the reaction coordinate across the range being analyzed? For molecular modelers, this matters because a profile is much harder to interpret when some regions have little or uneven sampling.
After umbrella sampling, GROMACS Wizard uses the Weighted Histogram Analysis Method (WHAM) to turn data from the simulation windows into a PMF profile. It also produces a histogram showing how the reaction-coordinate space is covered. Looking at both plots together is a practical way to assess the result—not just to obtain a curve, but to see where the underlying coverage may need attention.
Start with compatible input data
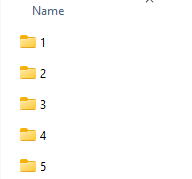
Before computing a PMF, confirm that the input folder contains the numbered subprojects from the umbrella-sampling workflow. They should belong to the same system and use the same reaction-coordinate definition. Mixing windows from different systems or coordinate setups can make the collection unsuitable for the analysis, even if the folders appear organized.
Open the WHAM Analysis tab in GROMACS Wizard. Select the project path, or use auto-fill if the previous project you ran was the umbrella-sampling simulation. Then check the folder contents rather than relying on the path alone.
The wizard loads information such as the reaction-coordinate details, time range, and temperature from the project. Select the coordinate you want to analyze. If your analysis calls for it, adjust optional settings such as custom bounds, time range, or energy units, then click Compute. For large trajectories, allow several seconds or minutes for the calculation.
Read the plots as a pair
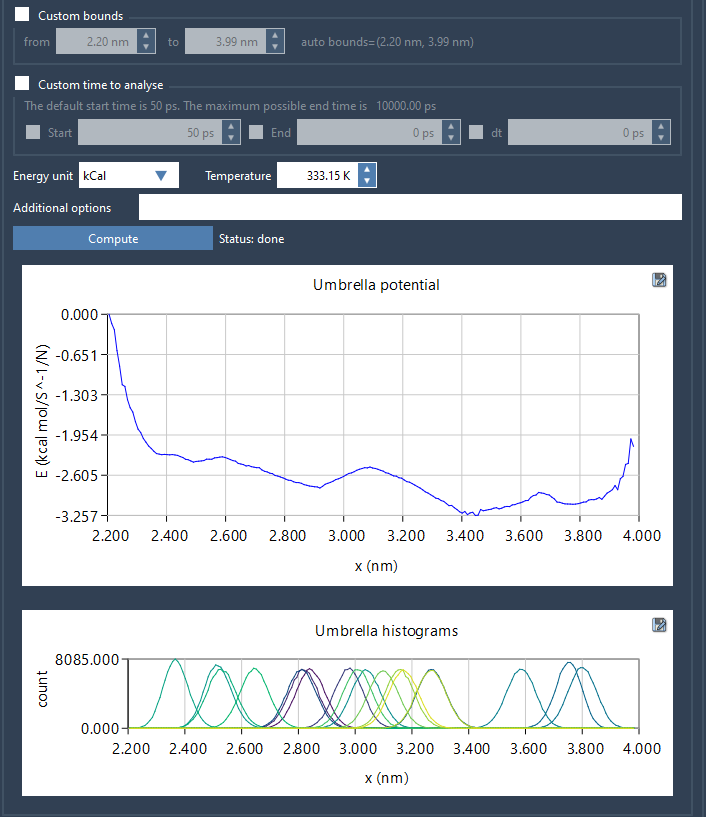
The calculation produces two plots: the PMF profile and a histogram of coverage along the coordinate. The profile is the free-energy result you came to inspect; the histogram provides useful context about how the coordinate space is represented in the input data.
Look for regions in the histogram where coverage is limited or uneven. These are places to review before drawing conclusions from the corresponding part of the profile. A sparse region is not, by itself, proof that a particular feature is wrong, and a histogram alone does not establish that a result has converged. It is a diagnostic aid: it can help identify where the available sampling may be insufficient and where more simulation could be worth considering.
A short review checklist
- Check the inputs: confirm that the subprojects describe the same molecular system and reaction-coordinate setup.
- Confirm the analysis choices: select the intended coordinate and review any custom bounds or time range.
- Inspect both outputs: compare the PMF profile with the histogram rather than viewing the profile alone.
- Respond to gaps: if some regions appear insufficiently sampled, return to umbrella sampling and add or extend simulations for the relevant windows.
- Keep track of results: GROMACS Wizard saves profiles, histograms, and plots in the project’s
wham_resultsfolder. If you later switch reaction coordinates, it reuses already computed data for the same parameters.
This workflow makes the coverage plot part of the interpretation process, not an afterthought. It helps turn “I have a PMF curve” into a more useful question: “Which parts of this curve are supported by the sampling I ran, and where should I investigate further?”
For the full procedure and related steps, see the GROMACS Wizard PMF Analysis documentation.
Note: SAMSON and all SAMSON Extensions are free for non-commercial use. Get SAMSON.