



A molecular trajectory can be hard to interpret when many atoms move at once. A ligand may rotate as it leaves a binding site, nearby residues may shift, and the full structure can make it difficult to see the overall direction of travel. One useful way to simplify that view is to track the center of mass (COM) of a chosen group of atoms along a path.
In SAMSON, the Pathlines visual model draws that COM motion on selected paths. It gives you a compact way to inspect where a ligand, residue group, or larger collection of atoms travels—without confusing the group’s overall displacement with every detail of its internal motion.
Choose what you want to follow
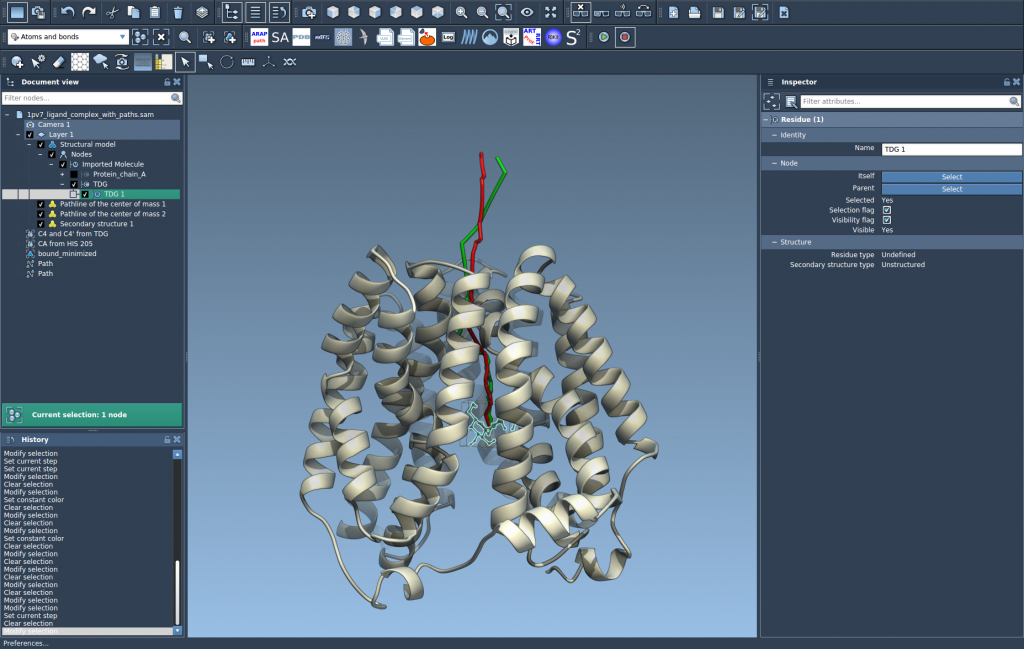
Start by loading a document that contains both a molecular structure and one or more paths. For a reproducible example, the Pathlines tutorial sample contains lactose permease (1PV7), the ligand thiodigalactosid (TDG), and unbinding paths generated with Ligand Path Finder.
In the Document view, select the atoms whose COM you want to follow, then select the path or paths to display. To select multiple nodes, hold Ctrl on Windows or Linux, or Cmd on macOS, while clicking. If you select no atoms, SAMSON uses the entire system; if you select no paths, it uses all paths in the document. These defaults are convenient, but explicit selections help keep the result focused when a document contains several molecules or alternative routes.

Create the pathline
With the atoms and paths selected, open Visualization > Visual model > More…. You can also use Ctrl/Cmd + Shift + V. Choose Pathline of the center of mass, then click OK. SAMSON creates a visual pathline showing the COM motion of the selected atoms along the selected path or paths.
Read the result at the right scale
A COM pathline is useful for questions about overall movement: Does the ligand move away from the binding site along the route? Do two candidate paths take the selected group in different directions? Does a domain undergo a large displacement? It can make those spatial patterns easier to see than inspecting every atom’s position individually.
It is also important to keep the representation in mind. The line describes the center of mass of the selected atoms, not the individual trajectories of all atoms in that group. A ligand can change orientation or shape while its COM follows a relatively simple route. If those internal changes matter to your question, inspect the structure and path as well as the pathline rather than treating the line as a complete description of molecular motion.
Explore and adjust
To inspect motion interactively, double-click a path in the Document view to start or stop it. Right-click a path to find its Path > … context-menu options. You can also select the path and open the Inspector with Ctrl/Cmd + 2 to access the path controllers.
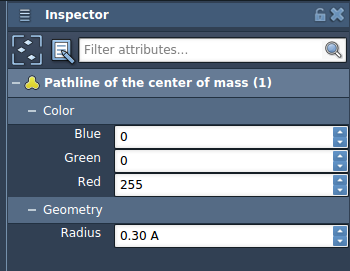
If the pathline is difficult to distinguish in the scene, select the pathline visual model and adjust its color or thickness in the Inspector. This is especially useful when comparing multiple displayed paths or when the model is visually dense.
One practical detail: deleting a path also removes its associated pathline. Deleting atoms used for a pathline changes the visualization. Keep that in mind when editing a document after creating the model.
Pathlines can help clarify ligand unbinding or rebinding routes, collective domain movement, and center-of-mass motion in reaction-coordinate workflows. For the complete walkthrough and sample setup, see the Pathlines documentation.
Note: SAMSON and all SAMSON Extensions are free for non-commercial use. Get SAMSON.