



A molecular trajectory can be difficult to interpret by eye. A structure may look as though it is expanding or collapsing, but a sequence of frames does not always make that trend easy to judge. A compactness measurement can help turn that visual impression into a quantity you can follow along a path.
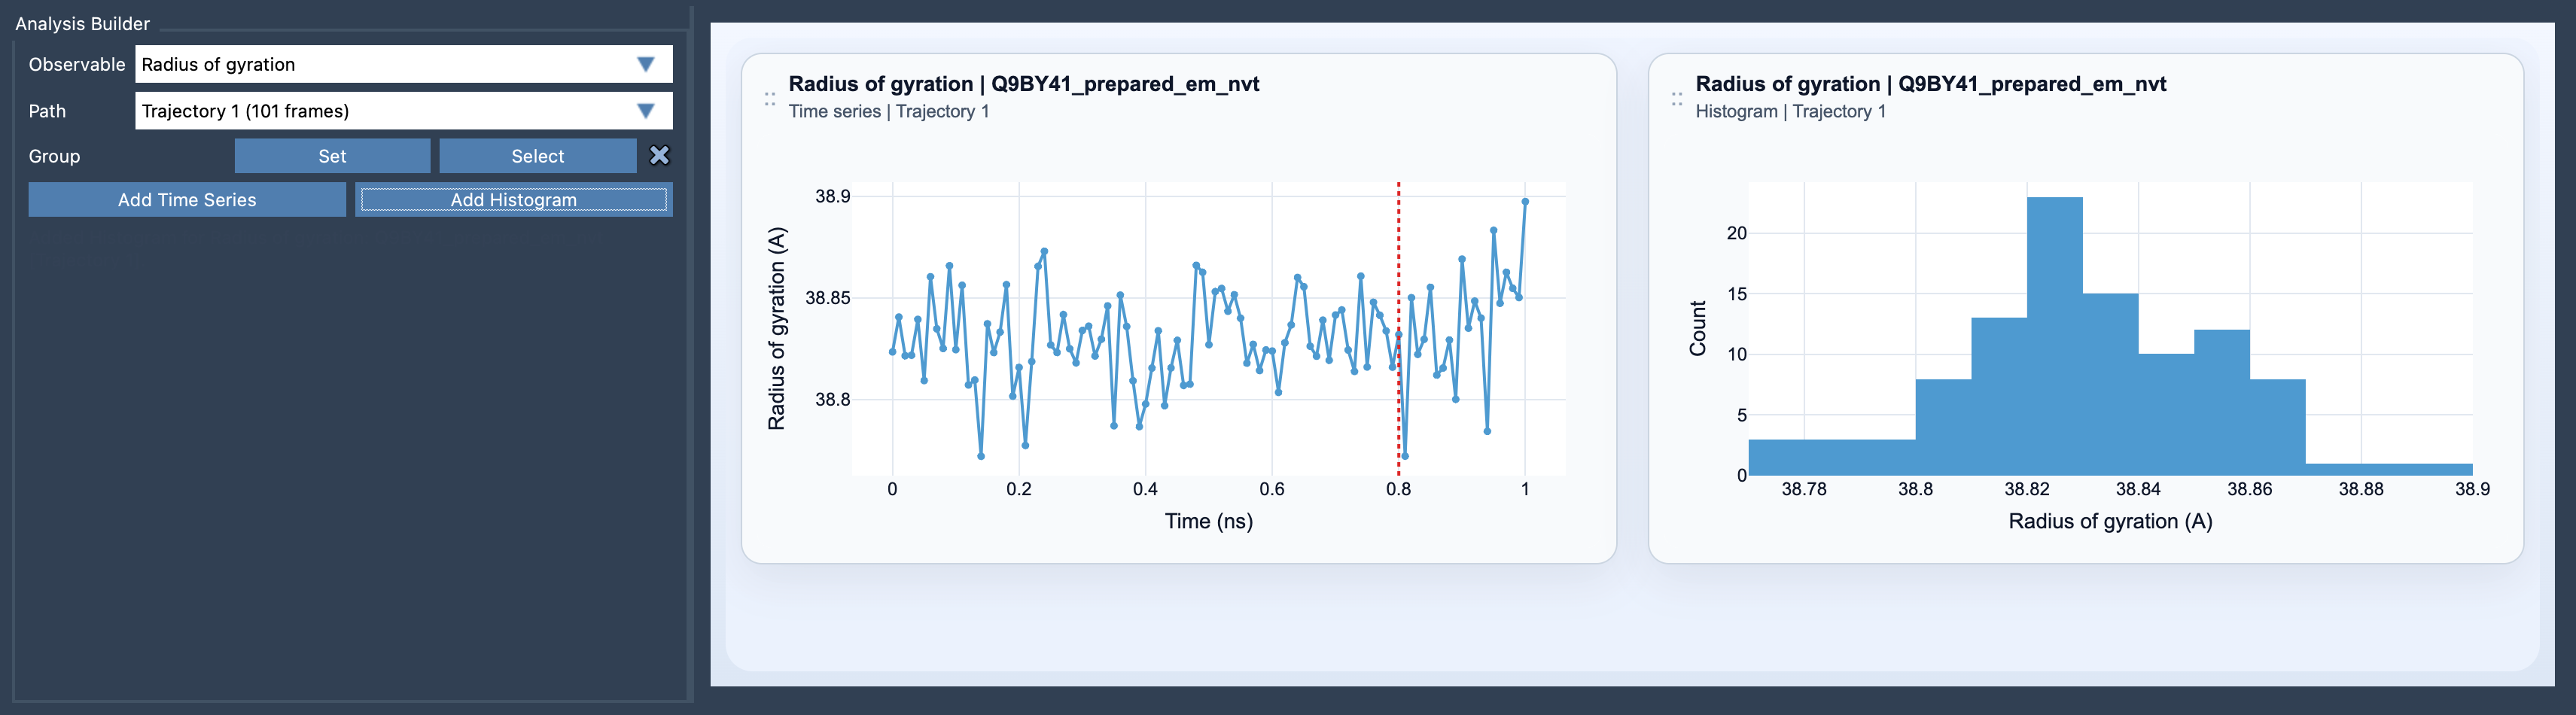
In SAMSON’s Path Analyzer, the radius of gyration is an observable for following the overall compactness of a selected group. Its time series can help you spot broad changes in size and shape—for example, whether the group tends to become more compact or more extended along the path. The result is reported in A.
Start with a clear question
Before adding a plot, decide what you want the measurement to tell you. Are you checking whether a selected group becomes more compact? Do you want to compare the range of compactness values visited along a path? A time series and a histogram answer different versions of these questions.
- Time series: shows how compactness changes along the path. It is useful for locating stretches where the value rises or falls, and for relating those changes to particular parts of the path.
- Histogram: summarizes the compactness values encountered. It helps you inspect which ranges occur more often, without showing the order in which they occurred.
These views complement each other. A histogram can reveal that a path visits more than one compactness range, while the time series can show when the shifts between those ranges happen.
Build the analysis
- Open Path Analyzer.
- Choose Radius of gyration as the observable.
- Select the path you want to inspect.
- Define the group to analyze. The analysis requires one atom-containing selection.
- Choose Add Time Series or Add Histogram, depending on the question you want to answer.
The group definition matters: the plot describes the selected atoms, not automatically the entire molecular system. If your question concerns a particular region, select that region. If you want to discuss whole-system compactness, make sure the group represents the system you mean to describe. When comparing results, keep the selection and the path context in mind so you are not interpreting differences caused simply by analyzing different groups.
Read the trend, not just the number
A changing radius of gyration is evidence of a change in the selected group’s overall compactness, but it does not, on its own, explain what structural rearrangement caused that change. Nor should a compactness trend alone be treated as proof of a particular event, such as folding. Use it as a diagnostic: it can tell you that a broad shape change is worth investigating, while other observations help clarify what kind of change occurred.
For example, if a time series rises over part of a path, you can inspect the corresponding structures to see what is changing in the selected group. If compactness remains similar but you suspect the shape is changing in another way, pair the analysis with Asphericity or Shape parameter. Those observables can add information about how the shape changes, rather than only how compact it is.
A useful habit is to state the scope of your conclusion precisely: “the selected group becomes more compact along this part of the path” is more informative than claiming that the whole molecule has folded based on one plot. That distinction keeps the analysis grounded in what the measurement actually shows.
For the setup details, see the Radius of Gyration documentation.
Note: SAMSON and all SAMSON Extensions are free for non-commercial use. Get SAMSON.