



A molecular structure can look different from one frame to the next without making it obvious whether it has become more compact, expanded, or simply changed shape. Watching an animation helps, but visual inspection alone can make gradual changes hard to compare across a long path or trajectory. The radius of gyration offers a simple first check: it tracks the overall compactness of a selected group as the structure changes.
It is useful to think of this measurement as a summary, not a complete description. A radius-of-gyration value gives you one way to follow how compact the selected group is; it does not, by itself, explain what caused a change or describe every detail of the group’s shape. That makes it a practical starting point for spotting a trend and deciding what to examine next.
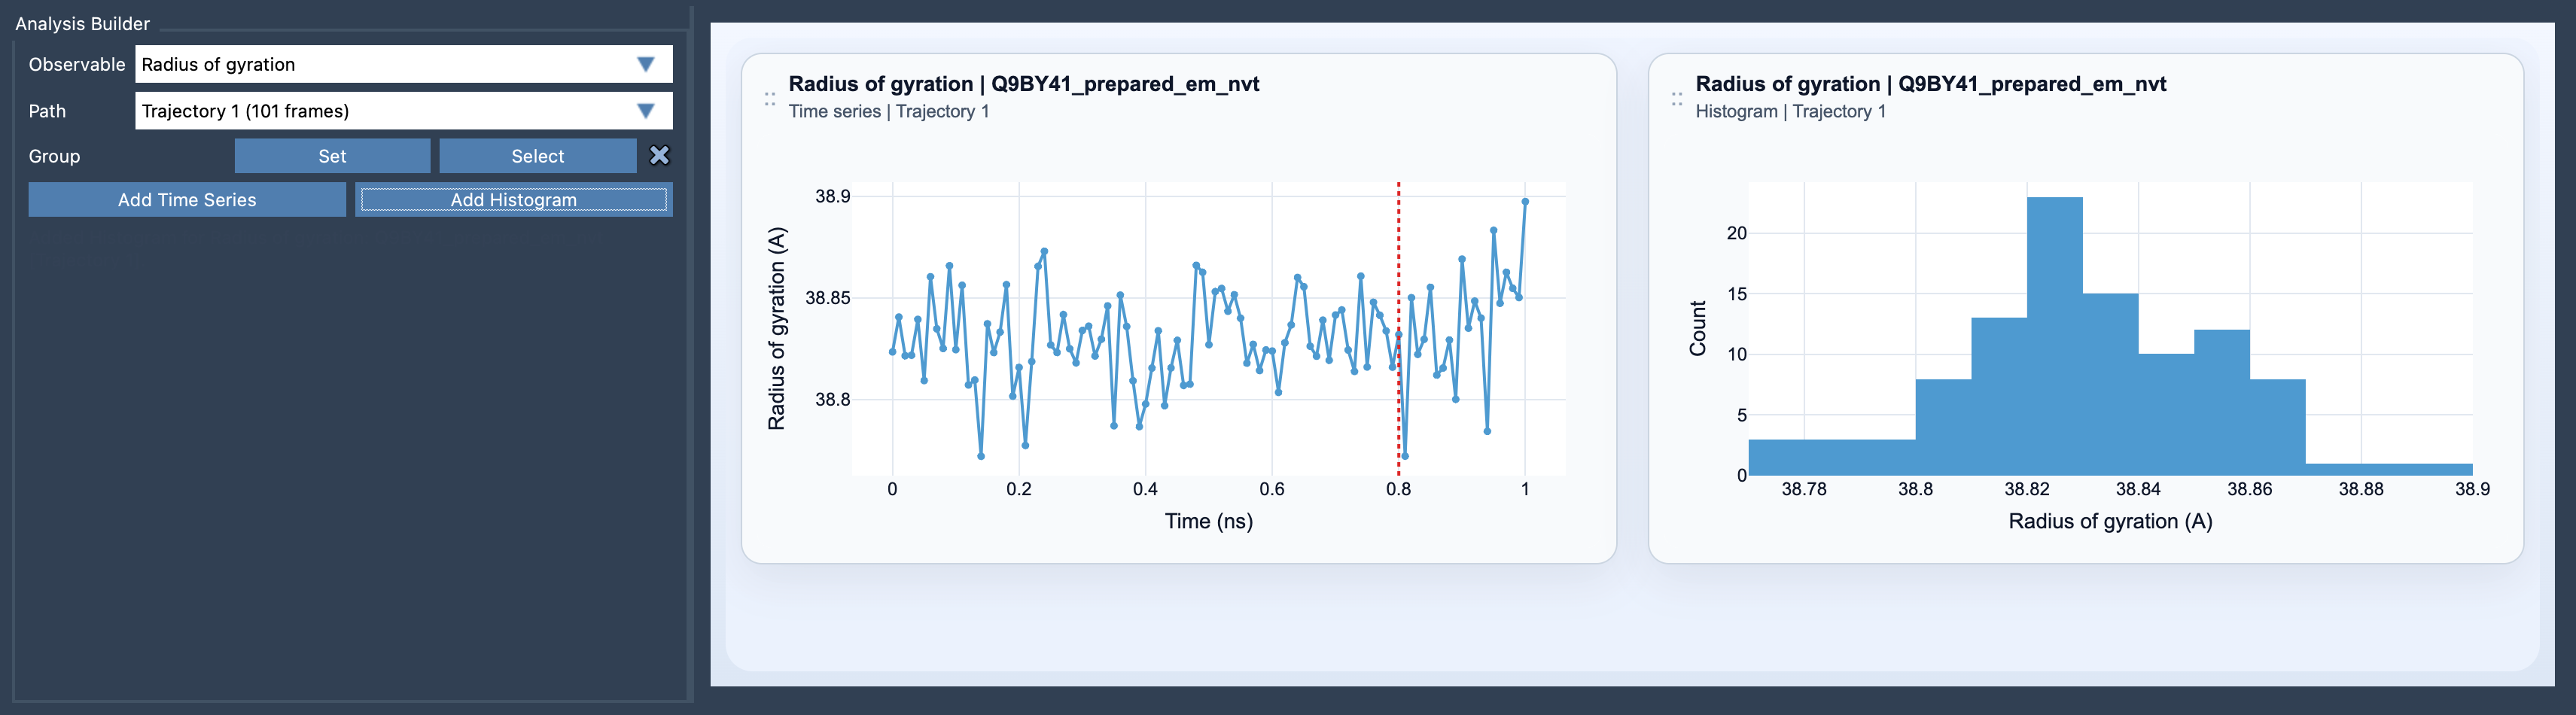
Build a compactness readout
- Open Path Analyzer.
- Set Observable to Radius of gyration.
- Choose the path you want to inspect.
- Define the group to analyze. The analysis requires one atom-containing selection.
- Choose Add Time Series to follow compactness along the path, or Add Histogram to inspect the preferred compactness range.
The result is reported in A. Keeping that unit in mind is especially helpful when you record or compare measurements from different analyses.
Read the pattern, not just the value
A time series is useful when your question is about change: does the selected group become more or less compact as the path progresses? Look at the overall pattern rather than reacting to a single point. A sustained shift is easier to interpret than an isolated fluctuation, but the plot alone does not tell you why the shift occurred.
A histogram answers a different question. Instead of emphasizing when a change happened, it helps you see which compactness range appears most often along the path. This can be useful when you want a quick overview of the range represented by the sampled structures.
For comparisons, be deliberate about what you select. If the group changes between analyses, the resulting measurements may not describe the same part of the structure. Use a consistent group when your goal is to compare paths or interpret a trend, and make clear which group the measurement represents.
Know what this measure can—and cannot—tell you
Radius of gyration is a strong first diagnostic for questions about folding, compaction, or swelling. But compactness is only one aspect of shape. Two structures can have similar compactness values while differing in how their shapes are arranged. If that distinction matters to your question, pair the analysis with Asphericity or Shape parameter. These complementary views help you examine how the shape changes, not only how compact it is.
The useful habit is simple: use radius of gyration to find a compactness trend, then bring in a shape-sensitive measure when the trend needs more context. To see the full setup details, learn more in the Radius of Gyration documentation.
Note: SAMSON and all SAMSON Extensions are free for non-commercial use. Get SAMSON.