



A molecular structure can change dramatically without any one measurement making the cause obvious. A trajectory may contain thousands of frames, and visual inspection alone can make it hard to tell whether a selected group is becoming more compact, expanding, or simply fluctuating. The radius of gyration offers a useful first check: it tracks the overall compactness of a group along a path.
In practical terms, radius of gyration describes how widely the atoms in the selected group are distributed around their center. A smaller value generally corresponds to a more compact arrangement; a larger value indicates that the atoms are spread farther out. It is a summary of overall size, not a complete description of shape—so it can reveal that a group changed without explaining exactly how.
Turn a long path into a readable signal
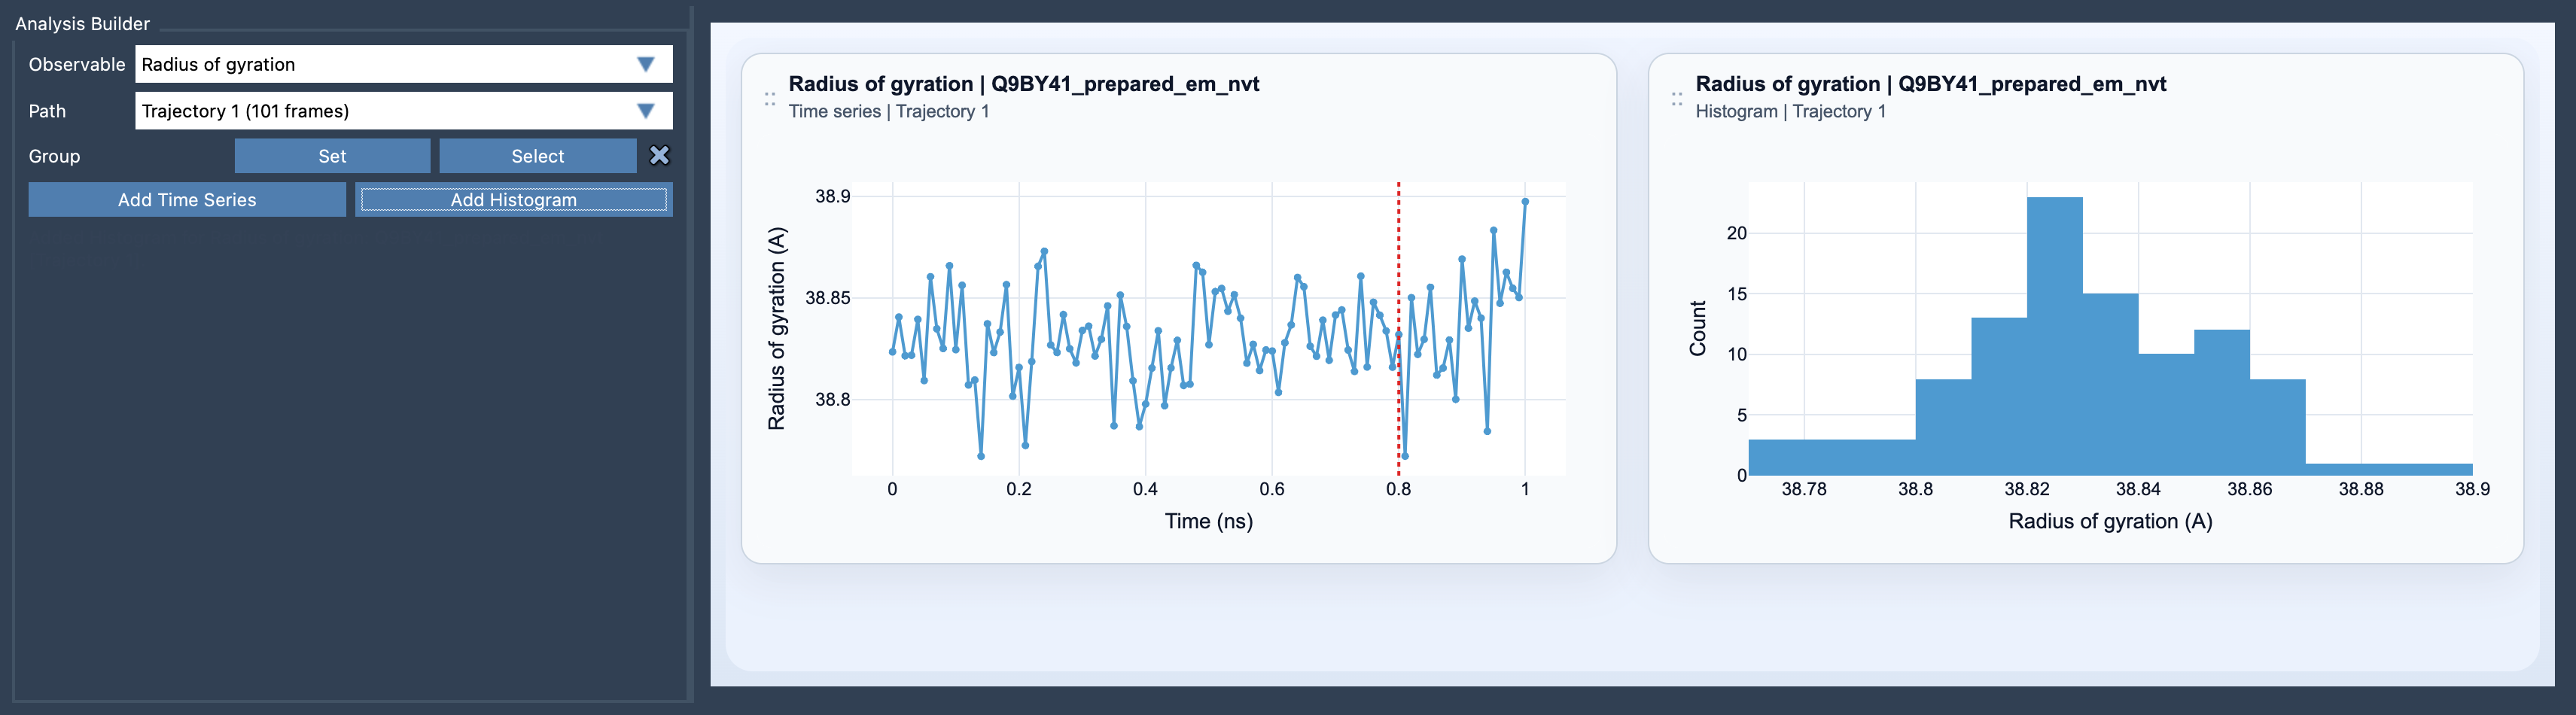
In SAMSON’s Path Analyzer, choose Radius of gyration as the observable, select a path, and define the group you want to examine. Then add either a time series or a histogram. The analysis requires an atom-containing selection, and the result is reported in A (ångströms).
The time series is the natural place to start when you want to know when compactness changes. Look for sustained increases or decreases, broad fluctuations, or intervals that appear comparatively steady. A gradual rise can be a prompt to investigate expansion; a fall can suggest compaction. These are clues to explore, not diagnoses by themselves: the radius of gyration does not identify the structural event responsible for a change.
A histogram answers a different question. Instead of emphasizing the order of frames, it shows which compactness values occur along the path and how often. This can help you see whether the path spends most of its time in a narrow range or samples a broader range. Because a histogram does not show when a value occurred, use the time series when the sequence of events matters.
Make the measurement answer a clear question
Before interpreting a plot, be deliberate about the group you select. The result describes that group—not automatically the entire molecular system. If you are interested in a particular component or region, make sure the selection represents it. When comparing analyses, keep the group definition consistent; otherwise, a difference in the plotted values may reflect a difference in what was measured.
It also helps to frame the result as a focused question: does this group become more compact along the path, and where does that change happen? Radius of gyration is particularly useful as a first diagnostic for folding, compaction, or swelling. If the measurement changes, inspect the relevant structures or use additional observables to ask what kind of shape change occurred.
Compactness is not the whole shape
Two structures can have similar overall compactness while differing in how their atoms are arranged. For that reason, radius of gyration is best treated as one piece of evidence rather than a complete structural interpretation. If you also need to understand how the shape changes, pair it with asphericity or shape parameter. Together, these observables can help distinguish a change in compactness from a change in shape character.
For the setup details, see the Radius of Gyration documentation.
Note: SAMSON and all SAMSON Extensions are free for non-commercial use. Get SAMSON.