



A molecular structure can look different from one frame to the next without making it obvious whether the whole group is becoming more compact, expanding, or simply changing shape. When you are reviewing a path or trajectory, that uncertainty can make large-scale structural changes hard to summarize. The radius of gyration offers a useful first measurement: it tracks the overall compactness of a selected group as it moves along the path.
What the measurement helps you see
Think of radius of gyration as a compactness indicator for the atoms in the group you select. If the value changes along a path, the spatial distribution of that group is changing. A rising trend can be consistent with expansion or swelling; a falling trend can be consistent with compaction or collapse. These are useful clues when inspecting folding-related motion or other large-scale changes.
The measurement is reported in A. It describes the selected group as a whole, so it is best treated as a summary rather than a complete explanation of the structure. Two conformations can have similar compactness while differing in their shape or in the arrangement of their parts. Radius of gyration can tell you that overall compactness changed; by itself, it does not tell you exactly how the shape changed or why.
Choose a group that matches your question
The group selection is central to the result. Before plotting, decide what you want to monitor: a whole structure, or a particular atom-containing selection whose compactness matters to your analysis. The Path Analyzer requires one atom-containing selection. Keep the selected group aligned with the question you are asking; a measurement for one region should not be interpreted as the compactness of the entire molecule.
This is also why it helps to write down the group used when you share or compare results. If two analyses use different selections, their values describe different sets of atoms, even if both plots are labeled radius of gyration. Clear selection choices make comparisons easier to interpret.
Use the view that answers your question
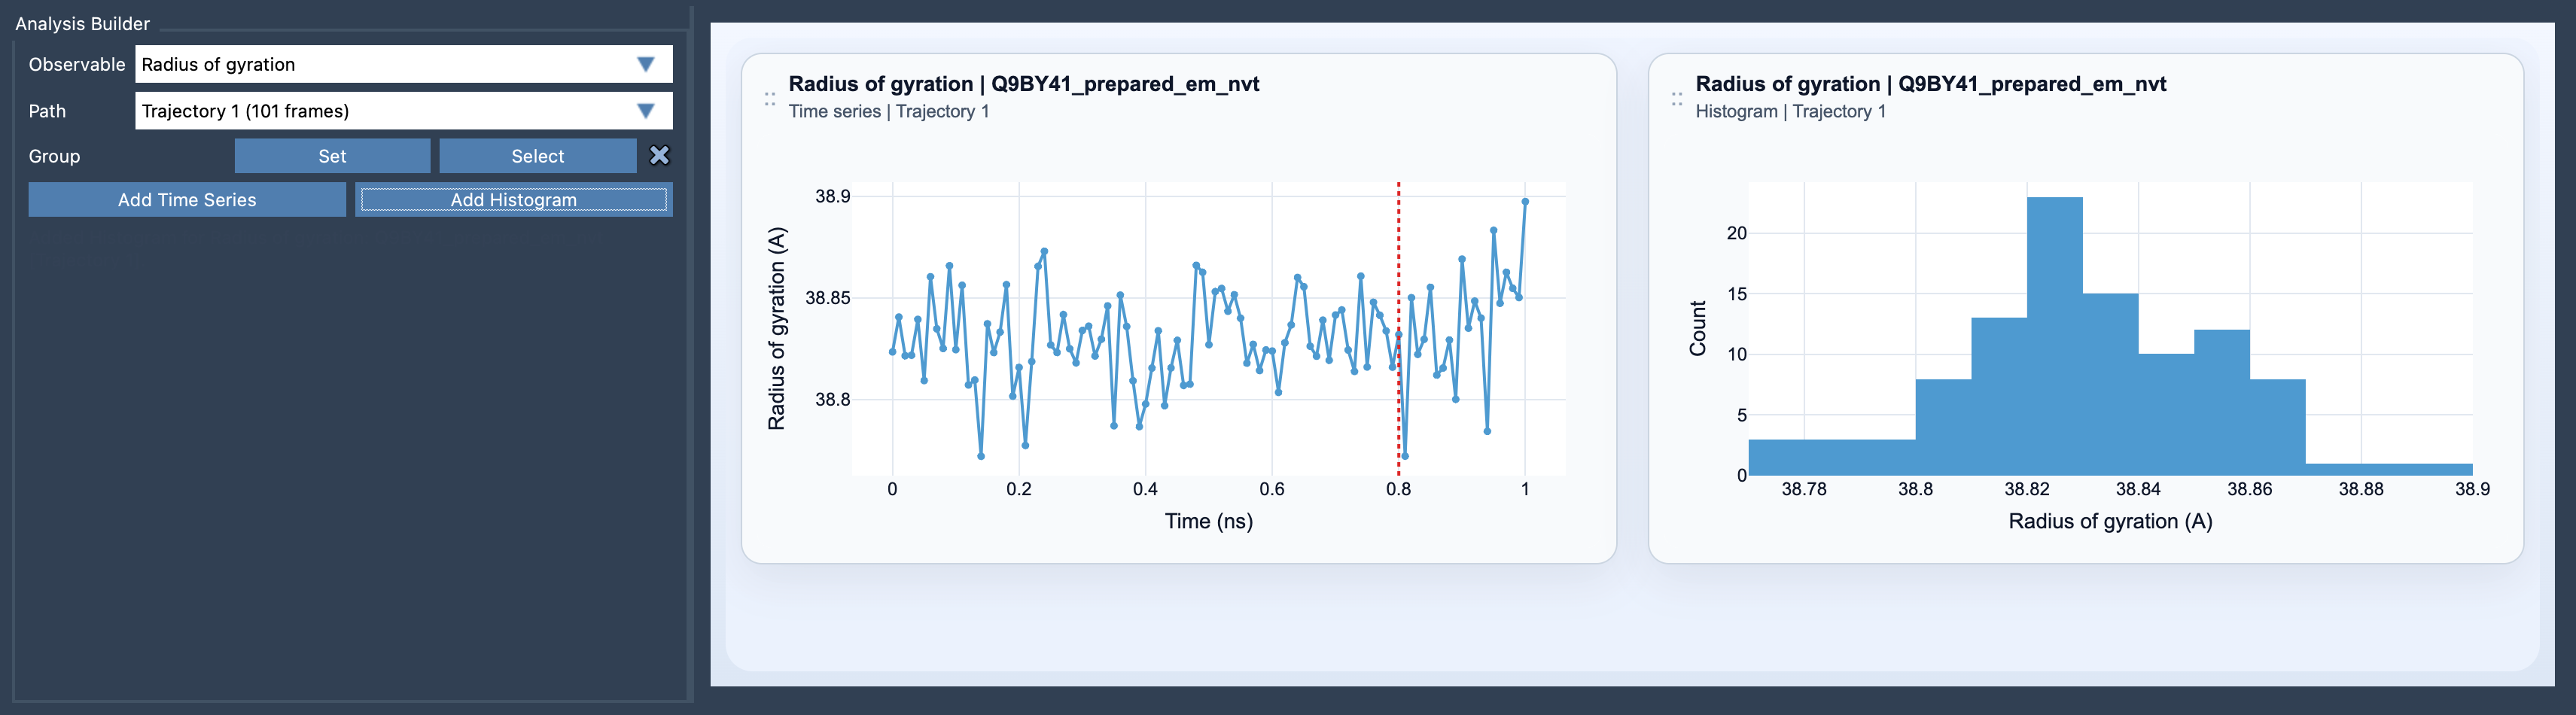
A time series is the natural choice when you want to follow compactness along the path. Look for broad trends and periods where the value changes, then return to the corresponding structures for visual inspection. Avoid treating a single increase or decrease as a full structural diagnosis: the plot is a prompt to investigate the conformations, not a substitute for doing so.
A histogram answers a different question. It shows the range of compactness values represented in the path and can help you inspect which ranges occur more often. However, a histogram does not preserve the order of the frames. If you need to know when a particular value occurred or whether the system moved gradually between ranges, use the time series as well.
A practical first-pass workflow
- Open Path Analyzer.
- Choose Radius of gyration as the observable and select the path you want to inspect.
- Define one atom-containing group that corresponds to your analysis question.
- Add a time series to follow changes in order, a histogram to inspect the represented range, or both when you need both views.
- Use the plot to identify patterns, then inspect the corresponding structures before drawing conclusions about the underlying motion.
Pair compactness with shape information
If your question is not only whether the group became more or less compact, but also how its shape changed, use radius of gyration as a starting point and pair it with Asphericity or Shape parameter. These complementary analyses can help distinguish a change in overall compactness from a change in shape. Together, they provide more context than any one summary value can offer.
For setup details, see the Radius of gyration documentation.
Note: SAMSON and all SAMSON Extensions are free for non-commercial use. Get SAMSON.