



A molecular structure can change substantially without any single atom movement telling the whole story. One region may spread out while another stays put; a flexible group may swing away from the rest of the molecule; or a structure may gradually become more compact. Looking at a trajectory frame by frame can make these overall changes difficult to summarize.
The radius of gyration offers a useful first check: it tracks the overall compactness of a selected group along a path or trajectory. Rather than describing a particular bond or local interaction, it gives you a single value for how broadly the group is distributed in space. In SAMSON’s Path Analyzer, you can view that value as a time series or as a histogram.
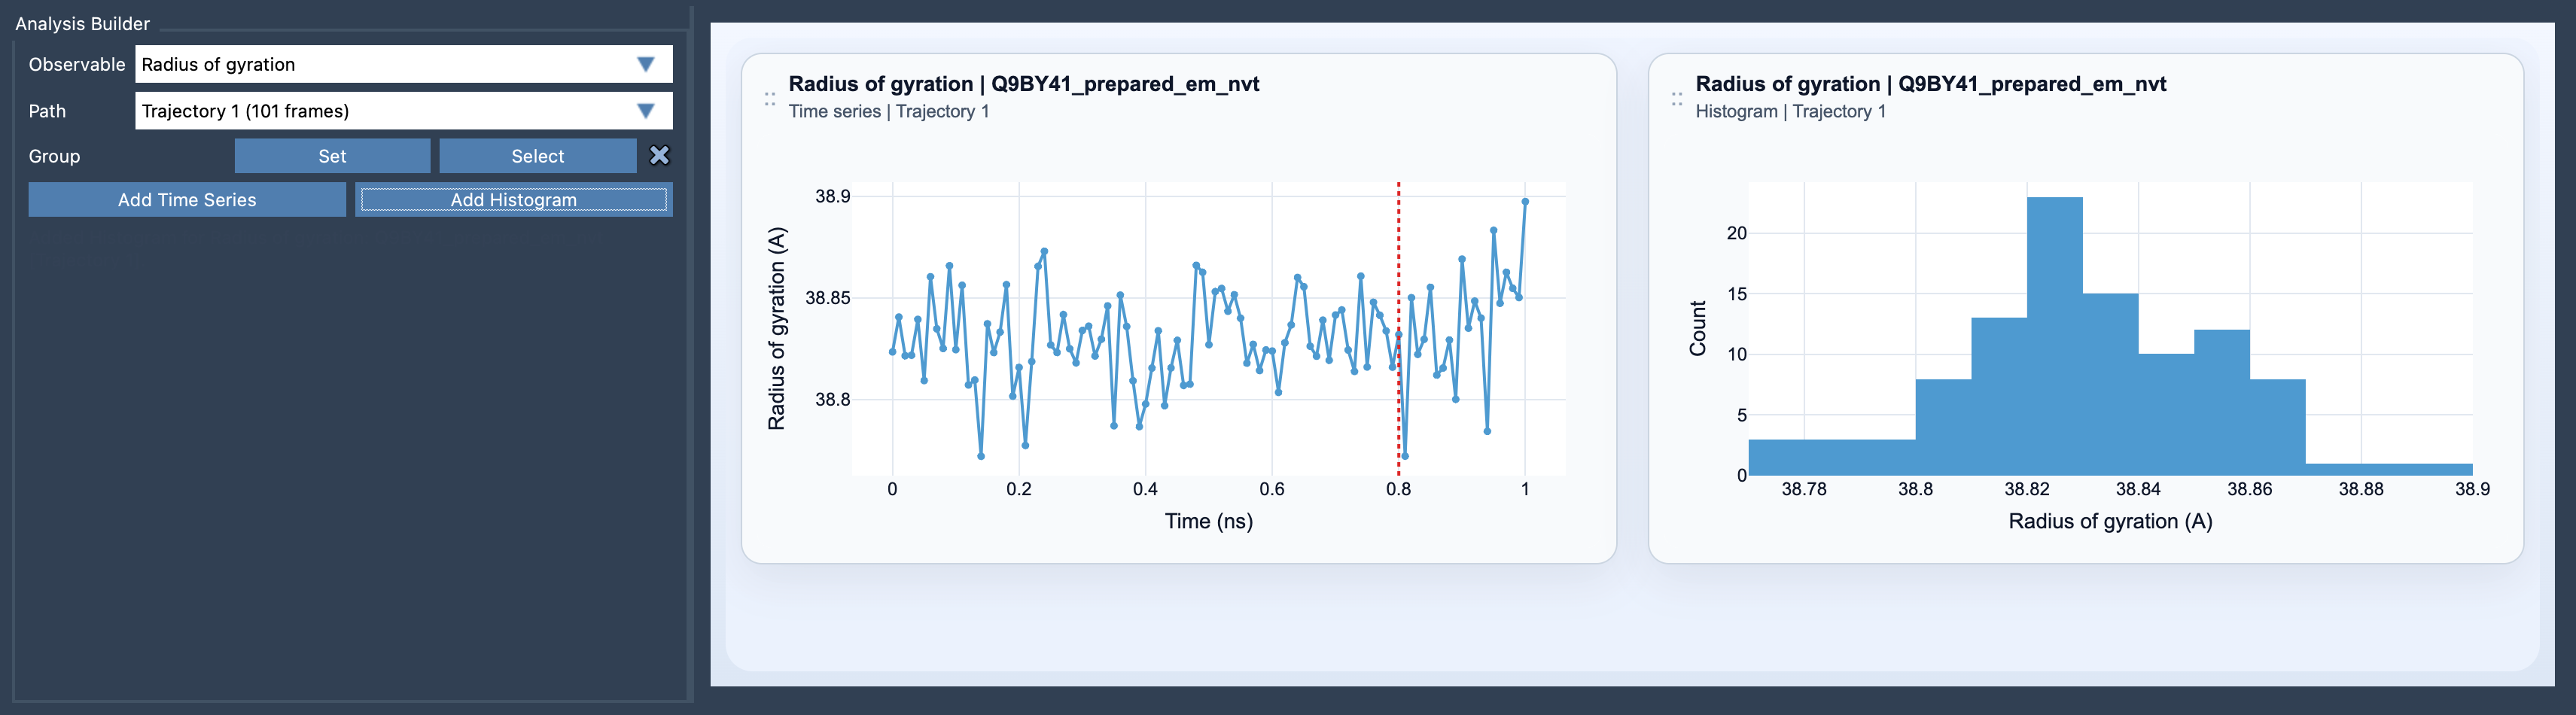
Read the trend before interpreting the mechanism
A rising radius of gyration indicates that the selected group is becoming more spread out overall; a falling value indicates that it is becoming more compact. This makes the measure a practical diagnostic when investigating expansion, collapse, or large-scale shape changes. It is a description of the group’s overall spread, though—not an explanation of why the change happened.
That distinction matters. A change in radius of gyration does not, by itself, identify which part of a molecule moved or what interaction caused the movement. Nor does one value capture every aspect of shape: two structures can have similar compactness while differing in how their atoms are arranged. Treat the plot as a useful overview, then use other analyses or structural inspection to investigate the details.
Make the group match the question
Before adding the plot, decide what you want to monitor. The result depends on the group you select, so be deliberate: a selection representing the whole structure answers a different question from one representing a particular region. The Path Analyzer requires one atom-containing selection for this observable, and reports the result in A.
For comparisons across a path, keep the group definition consistent. If the selection changes, a difference in the plotted values may reflect a difference in what you measured rather than a change in the structure. This simple check can prevent a misleading conclusion when comparing segments or alternative paths.
Choose the view that fits your question
- Time series: Use this to follow compactness along the path. Look for gradual trends, abrupt changes, or stretches where the value remains relatively steady. It helps you locate where to inspect the structures more closely.
- Histogram: Use this to inspect the compactness range that occurs along the path. It can show whether values cluster around a range or span a broader set of compactness states. Because a histogram does not show the order in which values occurred, use the time series when sequence matters.
A practical first-pass workflow
- Open Path Analyzer.
- Choose Radius of gyration as the observable and select the path you want to inspect.
- Define the atom-containing group that matches your question.
- Add a time series to see how compactness changes along the path, or add a histogram to inspect its range.
- When you see a feature of interest, inspect the corresponding structures and consider whether you also need a measure of shape.
If compactness changes but you also want to understand how the shape changes, pair this analysis with Asphericity or Shape parameter. Radius of gyration is a clear starting point for folding, compaction, or swelling questions; complementary measures help add geometric context.
For setup details, see the Radius of gyration documentation.
Note: SAMSON and all SAMSON Extensions are free for non-commercial use. Get SAMSON.