



A molecular structure can look almost unchanged while a side chain rotates, a backbone torsion shifts, or a larger part of the system twists. These motions can influence how a conformation changes, yet they are easy to miss when you inspect structures one at a time. A dihedral plot offers a focused way to follow one such motion across a path or trajectory.
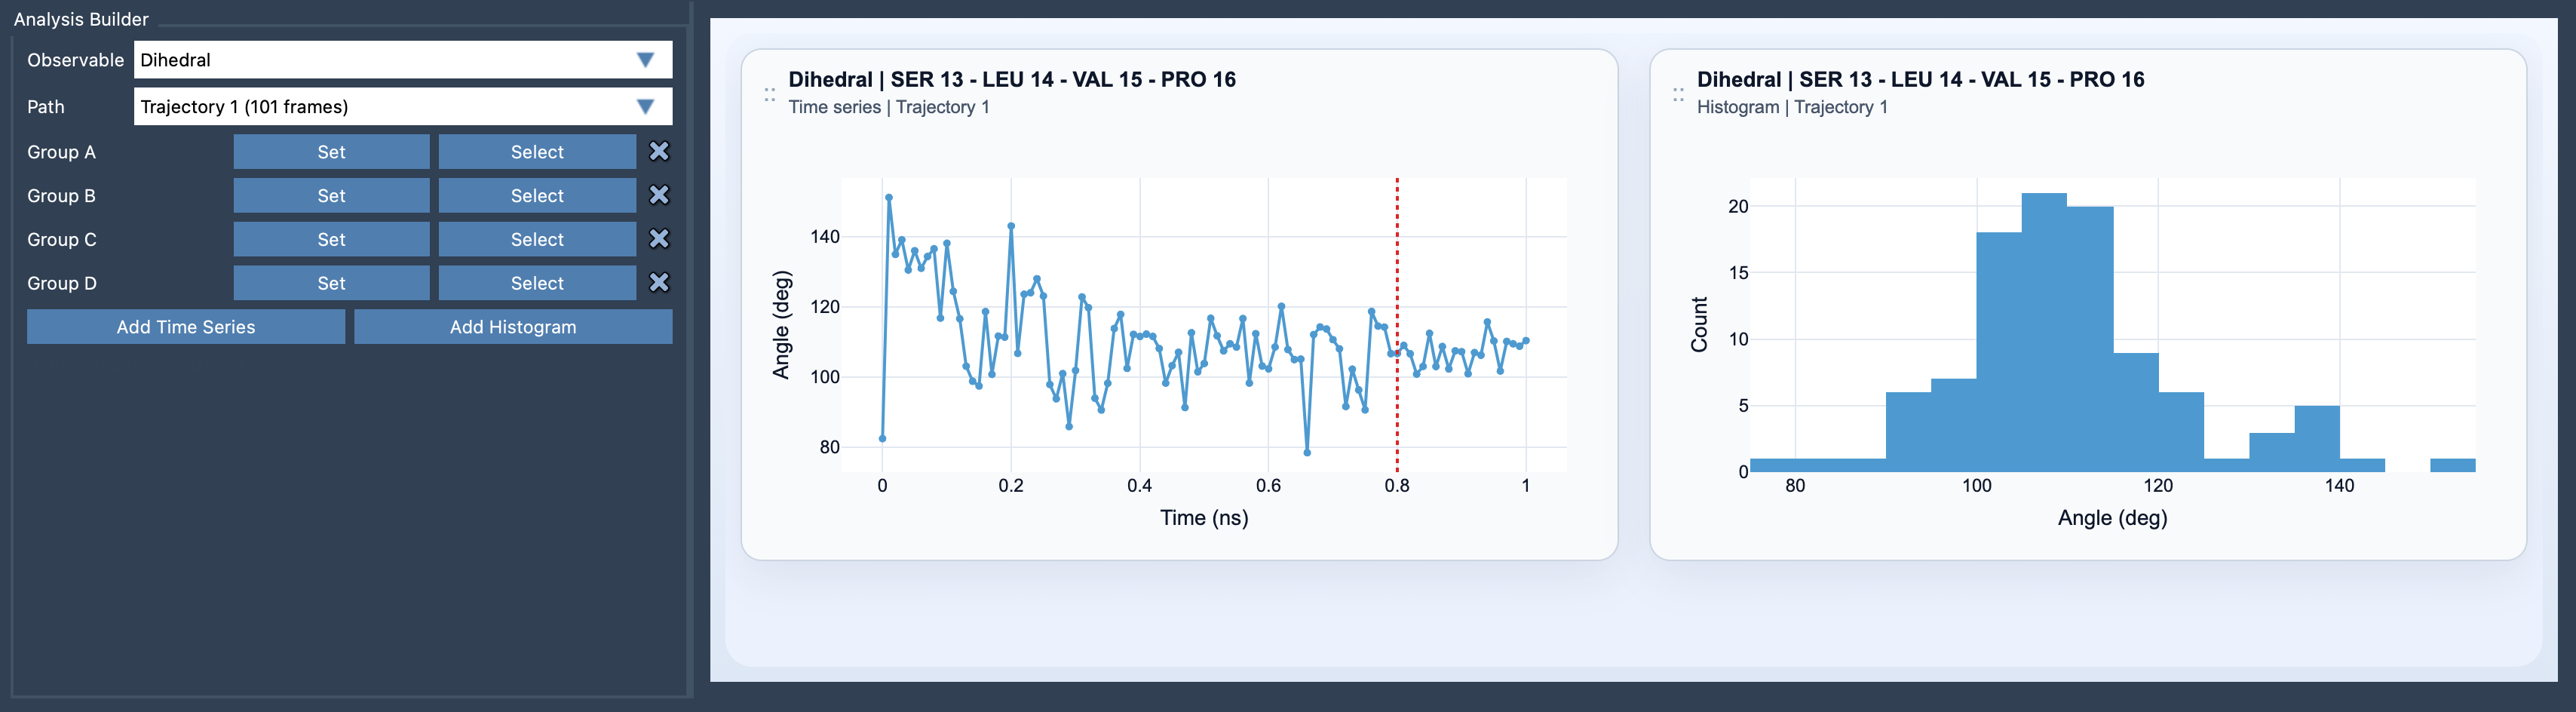
In SAMSON’s Path Analyzer, a dihedral is defined by four ordered groups: A, B, C, and D. Their representative positions form the sequence used to calculate the torsion angle. The B–C pair defines the central bond or geometric axis; A and D provide the positions on either side that make the rotation measurable. The result is plotted in degrees.
Choose groups with the geometry in mind
One important detail is how each selection becomes a position. If a group contains a single atom, that atom’s position is used. If it contains several atoms, Path Analyzer uses the group’s center of mass. This gives you flexibility, but it also means the plot represents the torsion between four representative positions—not necessarily a conventional four-atom torsion unless each group contains the intended atom.
Before plotting, check the order of the selections and ask what each one represents. In particular, confirm that Groups B and C describe the central axis you want to examine. If you use multi-atom groups, consider whether their centers of mass are meaningful markers for the motion. A broad selection may summarize a region rather than track a specific atom-level rotation.
Use the plot that answers your question
Choose Add Time Series when you need to locate changes along the trajectory or path. It helps answer questions such as: Does the torsion remain steady, shift gradually, or change over a particular section of the path? This view is useful when the timing or position of a transition matters.
Choose Add Histogram when your first question is about the torsional states that appear most often. A histogram can make preferred or metastable conformations easier to spot, without requiring you to scan every frame individually. It is a useful overview, but it does not show when a transition occurred; use the time series for that.
A practical analysis sequence
- Open Path Analyzer and select Dihedral as the observable.
- Choose the path you want to analyze.
- Define Groups A, B, C, and D in the order that matches the torsion you want to measure.
- Review whether each group is a single atom or a multi-atom selection, keeping the center-of-mass rule in mind.
- Add a time series to inspect the progression, or a histogram to compare the distribution of torsional states.
For a broader interpretation, compare the torsion with other observables. RMSD can help relate a local twist to overall structural change, while Energy can help examine whether torsional changes accompany energetic changes. These comparisons provide context; the dihedral itself measures the selected torsional geometry.
When a structure appears static, a well-chosen dihedral can reveal the motion that matters. The key is to be deliberate about the four groups and to select a plot that matches the question: when did the twist change, or which torsional states were observed?
Learn more in the Dihedral documentation.
Note: SAMSON and all SAMSON Extensions are free for non-commercial use. Get SAMSON.