



A protein can look broadly similar at a glance while parts of its backbone quietly change state. The reverse is also possible: a noticeable motion may leave the overall fold’s secondary-structure balance nearly unchanged. For molecular modelers comparing frames along a path, inspecting one structure at a time can make these changes hard to track.
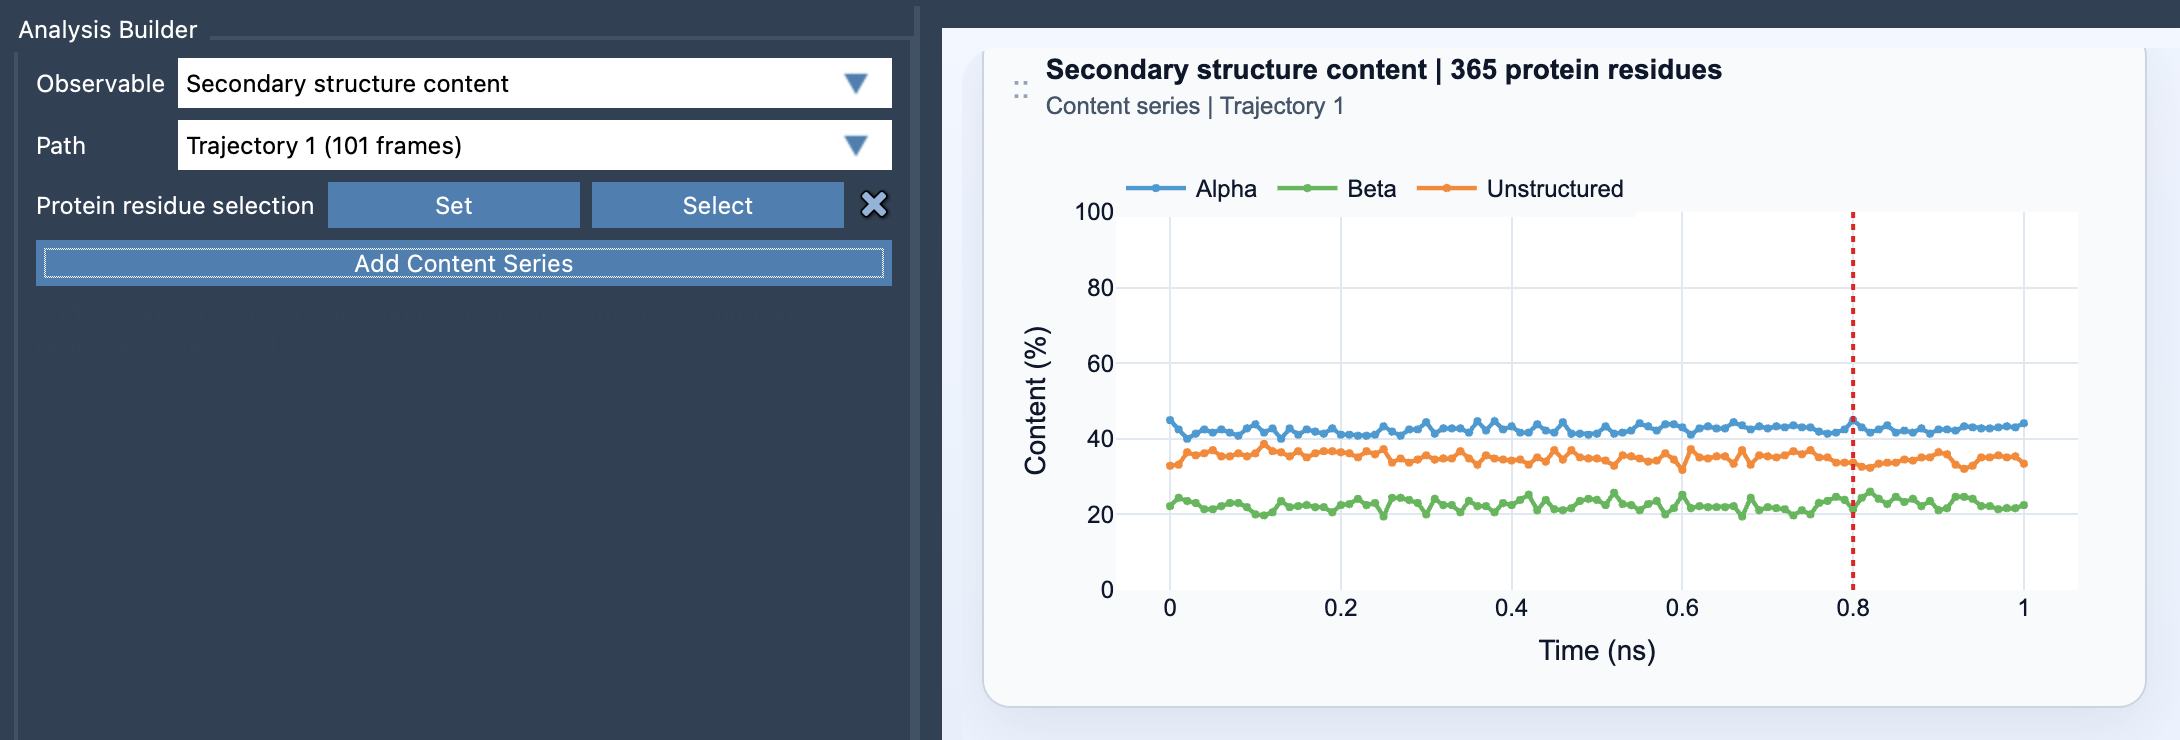
The Secondary structure content analysis in SAMSON’s Path Analyzer offers a compact way to follow that story. It reports the percentage of selected protein residues classified as alpha, beta, or unstructured at each frame. The result is a multi-series plot, so you can see whether the selected region’s backbone-state composition shifts as you move along the path.
Read the trend, not just a single frame
Suppose you are reviewing a conformational path and want to know whether a region loses helical character, gains beta structure, or becomes more unstructured. A static view might show where residues are in space, but it does not summarize how the region’s secondary-structure assignments change from frame to frame. The content plot gives you that high-level comparison in percentage terms.
For a selected set of protein residues, the calculation is straightforward: at each frame, the count assigned to a category is divided by the total number of selected protein residues, then multiplied by 100. In symbols, the alpha percentage is 100 × Nα(t) / Nres; beta and unstructured percentages are calculated the same way using their respective residue counts. This makes the values easier to interpret across selections of different sizes.
Choose the selection to match the question
A broad selection can help answer, “Is the protein’s overall secondary-structure composition changing along this path?” A focused selection is more useful when you already have a specific area in mind—for example, a domain, helix bundle, or loop-rich region. The choice matters: a local change can be diluted in a protein-wide summary, while a small region may make the overall picture difficult to interpret if your question concerns the whole protein.
To create the plot, open Path Analyzer, choose Secondary structure content under Observable, select a path, define a protein residue selection, and click Add Content Series. The selection must contain atoms belonging to protein residues.
Use the plot as a signal, not a verdict
A rising or falling curve tells you that the selected residues’ assigned categories are changing along the frames. It does not, by itself, explain why the change occurs or establish whether a conformation is stable, favorable, or biologically important. Treat it as a useful summary that helps you spot where to investigate—not as a substitute for examining the structures and the scientific context.
There is also a useful scale distinction. The content series summarizes the selection as a whole; it does not identify which individual residue changed. If you need residue-level backbone detail, pair this overview with the Ramachandran analysis. Together, the two views can help you first locate a broader change in secondary-structure content, then investigate backbone behavior at finer resolution.
A practical review might start with a broad selection to check for an overall trend, then repeat the analysis on a domain or loop-rich region if the summary suggests a change worth examining. Keeping the question and selection aligned makes the plot more informative and helps prevent local behavior from being mistaken for a protein-wide shift.
For setup details and the equations, see the Secondary Structure Content documentation.
Note: SAMSON and all SAMSON Extensions are free for non-commercial use. Get SAMSON.