



A protein can move through many conformations while its overall shape remains difficult to summarize. Looking at individual snapshots may reveal a helix here or a strand there, but it can be hard to tell whether the selected region is undergoing a broader change as the structure moves along a path. A compact way to investigate that question is to track the percentages of residues assigned to alpha, beta, and unstructured states at each frame.
In SAMSON’s Path Analyzer, Secondary structure content turns those residue counts into a multi-series plot. It is useful when you want a high-level view of backbone-state changes without inspecting every residue at every frame. For instance, a rising alpha percentage alongside a falling unstructured percentage can flag a shift worth examining more closely. The plot helps you see the pattern; it does not, by itself, explain the molecular cause.
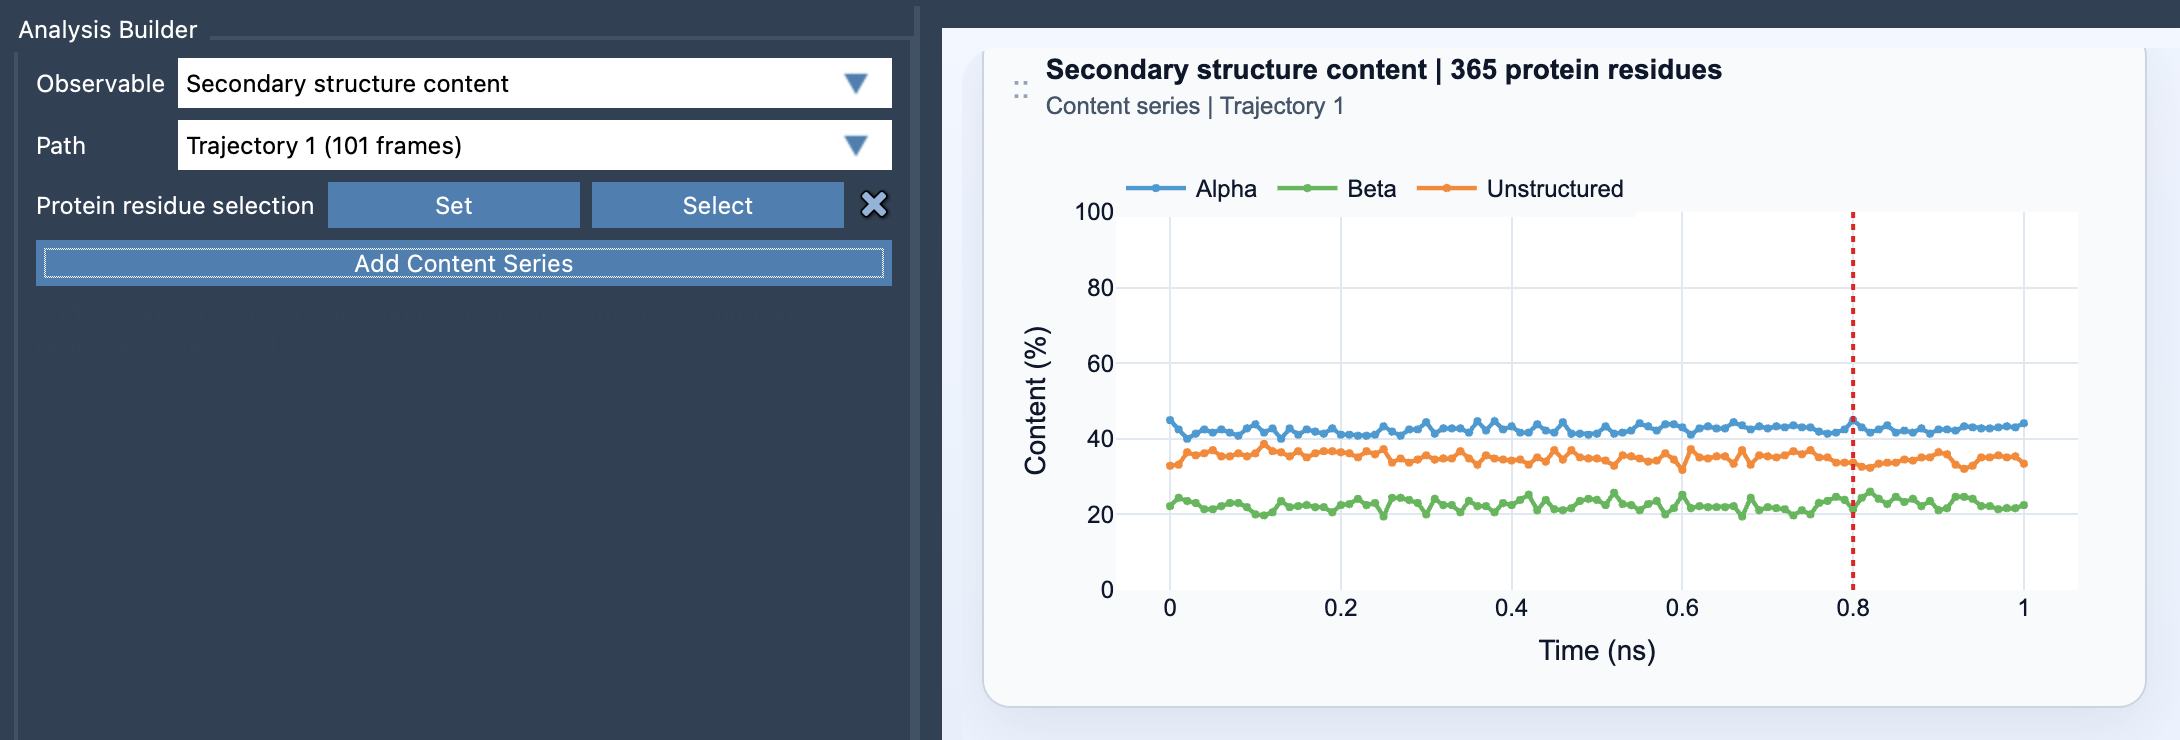
What the plot measures
At each frame, Path Analyzer recomputes secondary structure along the selected path for the chosen protein residues. It reports three percentages: Alpha, Beta, and Unstructured. Each value is the number of selected residues in that category divided by the total number of selected protein residues, multiplied by 100.
In plain language, the plot answers: “Of the residues I selected, what percentage is in each reported state at this frame?” The denominator matters. If you change the selection, you change the population being summarized. A protein-wide selection and a selection restricted to one domain can therefore tell different stories about the same path—and both can be useful, as long as you know which residues each plot represents.
Make comparisons that mean something
When comparing paths or regions, keep the residue selection consistent wherever possible. Otherwise, a difference in percentages may come from changing the set of residues rather than from a structural change along the path. For a broad overview, select a wide protein region. To investigate a suspected local rearrangement, focus on a domain, helix bundle, or loop-rich region. A focused selection can make a local trend easier to spot, while a broad one gives context about the protein as a whole.
Also keep the plot’s resolution in mind. It summarizes many residues into three categories, so it can reveal an overall balance but not identify which residues changed state. A small shift may reflect a change in only a few residues, especially in a small selection. Treat the plot as a screening view: use it to locate intervals or regions that deserve closer inspection, rather than as a substitute for residue-level analysis.
From overview to investigation
A practical workflow is to start with the protein-wide view, note where the three series change, and then repeat the analysis for a focused selection around the region you want to understand. This helps distinguish a local change from a broader shift. To add the analysis, open Path Analyzer, choose Secondary structure content under Observable, select a path and protein residue selection, then click Add Content Series.
If the summary points to a change but leaves you wondering which backbone conformations are involved, pair it with the Ramachandran analysis. The secondary-structure plot provides the compact overview; residue-level backbone information can help you investigate the details.
One final interpretation check: the plot follows frames along the selected path. Read its horizontal axis in the context of that path; do not assume it represents elapsed physical time unless the path itself corresponds to a time series.
For the full setup details and equations, see the Secondary Structure Content documentation.
Note: SAMSON and all SAMSON Extensions are free for non-commercial use. Get SAMSON.