



A protein can move through a path of conformations while its overall shape changes only subtly. That can make it difficult to tell whether a region is retaining its backbone structure, gaining or losing helices or sheets, or becoming more disordered. Looking at individual frames one at a time is especially easy to misread: the important signal may be a gradual shift across many frames.
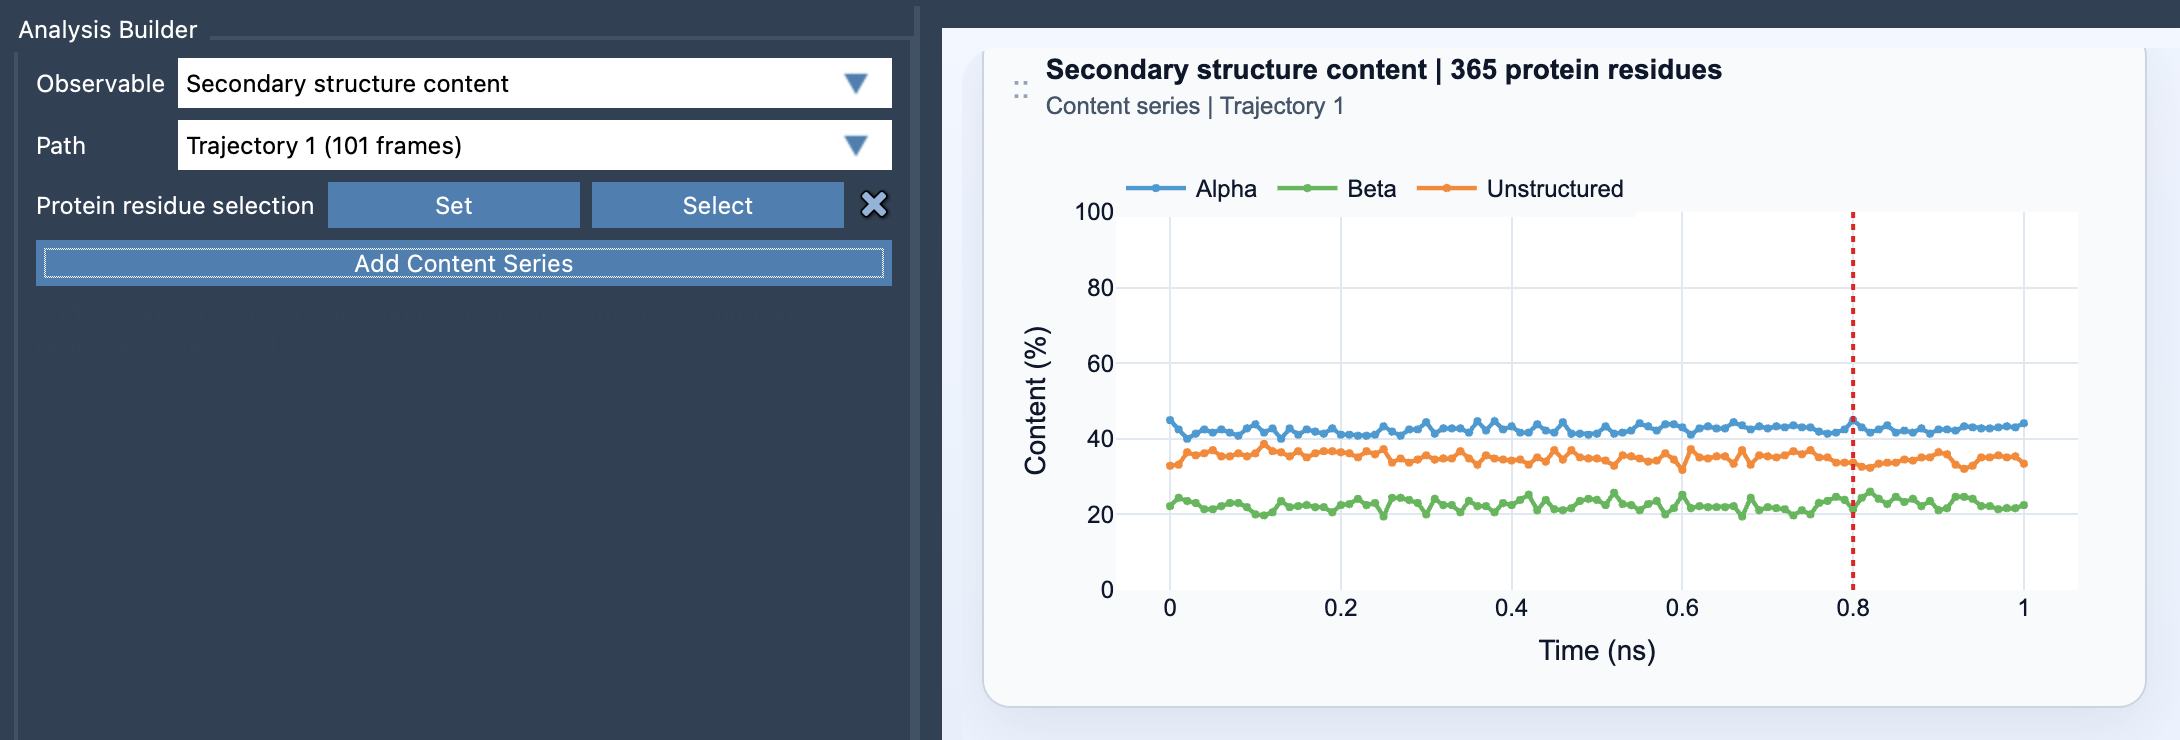
Secondary structure content provides a compact way to follow that shift. In SAMSON’s Path Analyzer, it reports the percentage of selected protein residues classified as alpha, beta, or unstructured at each frame along a path. Instead of inspecting only the molecular geometry, you can see how the selected residues’ backbone-state composition changes over time.
What the plot tells you
The result is a multi-series plot with values from 0 to 100%. At each frame, the percentage for a category is its residue count divided by the total number of selected protein residues, multiplied by 100. In other words, the plot answers a practical question: “What fraction of this selection is alpha, beta, or unstructured right now?”
That makes the plot useful for spotting broad trends. For example, a sustained decrease in the alpha percentage alongside an increase in the unstructured percentage can flag a change worth investigating. A shift between alpha and beta content may also be informative. The plot summarizes the selected residues, though; it does not show which specific residue changed. Treat it as a signal for where to look next, not a residue-level explanation or proof of a particular mechanism.
Choose the selection to match the question
The selection determines the meaning of the summary. A broad protein selection is useful when you want an overview of the whole protein. If you are investigating a particular domain, helix bundle, or loop-rich region, use a focused selection instead. A local change can be diluted in a whole-protein average, while a focused selection makes the analysis specific to the region you care about.
The selection must contain atoms belonging to protein residues. Before interpreting a plot, check that you selected the intended residues and that the region is large enough to answer your question. Keep the selection consistent when comparing paths or portions of a path; changing the denominator changes what the percentages represent.
A quick workflow
- Open Path Analyzer.
- Choose Secondary structure content as the observable.
- Select the path you want to examine.
- Define a protein residue selection, either broad or focused.
- Click Add Content Series and inspect how the three percentages evolve across frames.
When reading the result, look for persistent trends rather than over-interpreting a single point. Ask whether one category rises as another falls, whether the change is localized to a selected region, and whether the shift is gradual or concentrated in a portion of the path. These are useful prompts for deciding what to inspect next.
For more detail, pair the summary with a residue-level backbone view such as the Ramachandran analysis. The content plot helps identify when and how the overall composition changes; a residue-level analysis can help investigate where backbone conformations may be changing.
Learn more in the Secondary Structure Content documentation.
Note: SAMSON and all SAMSON Extensions are free for non-commercial use. Get SAMSON at www.samson-connect.net.