



A molecular path can be difficult to interpret when the motion you care about belongs to only a ligand, residue, or domain. Watching the entire structure move may make a ligand’s route hard to follow; tracking every atom can add detail without making the overall displacement clearer. A useful middle ground is to visualize the center-of-mass (COM) motion of a selected group of atoms along a path.
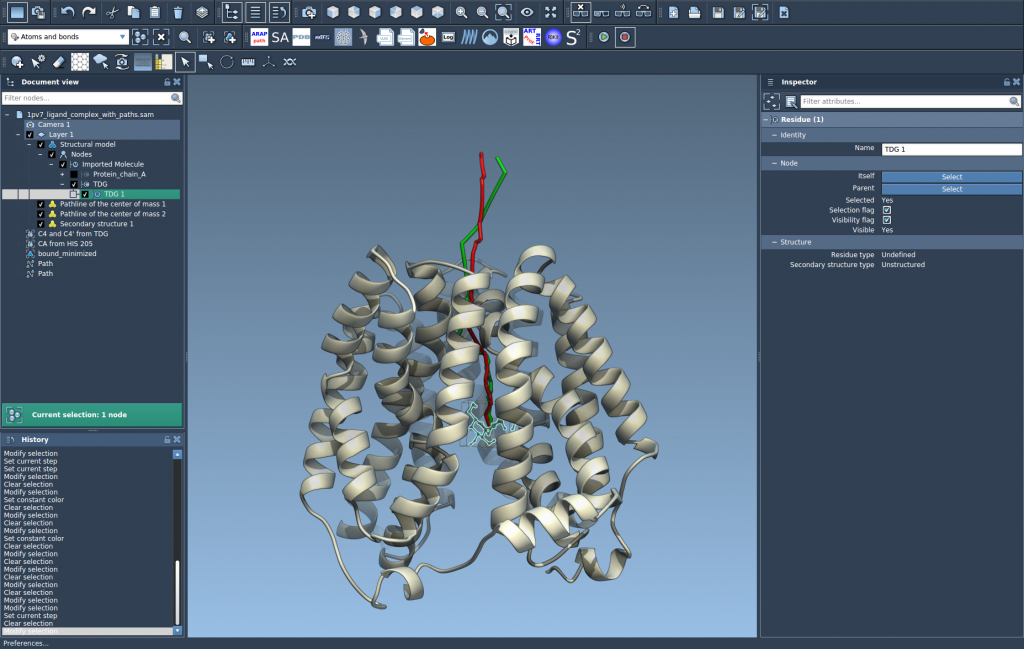
In SAMSON, the Pathlines visual model draws that COM motion as a line along one or more paths. The result gives you a compact way to compare where a chosen group moves, while the molecular structure and path remain available for context. This can help when inspecting ligand unbinding routes, domain movement, or other path-based workflows.
What a pathline represents
A pathline is not a separate simulation or a prediction of motion. It visualizes the center of mass of the atoms you select as they move along an existing path. The selected group matters: a ligand-only selection answers a different question from a selection containing the ligand and nearby protein atoms. Choose the group that matches the motion you want to inspect.
This distinction is also useful when interpreting the result. A COM path summarizes a group’s displacement; it does not show every atom’s individual trajectory or explain why the group moved. Use it as a readable overview, then inspect the structure and path for molecular detail.
Build a focused view in SAMSON
- Prepare the Pathlines extension. Sign in to SAMSON Connect, open the Pathlines extension page, click Add, and restart SAMSON.
- Load a system with paths. For a ready-to-follow example, download the sample document from SAMSON Connect using Home > Download. It includes lactose permease (
1PV7), the ligand thiodigalactoside (TDG), and two unbinding paths generated with Ligand Path Finder. - Select the atoms and paths. In the Document view, select the atom group whose COM you want to follow and the path or paths to display. Hold Ctrl on Windows or Linux, or Cmd on macOS, to add nodes to the selection. Be aware of the defaults: if you select no atoms, the whole system is used; if you select no paths, all paths in the document are used. Making an explicit selection helps keep the visualization focused.
- Create the visual model. Choose Visualization > Visual model > More…, select Pathline of the center of mass, and click OK.

Follow and adjust the result
Double-click a path in the Document view to start or stop it. Right-click a path to find its Path > … options. To access path controllers, select the path and open the Inspector with Ctrl/Cmd + 2. You can also select the pathline visual model and adjust properties such as color and thickness in the Inspector.
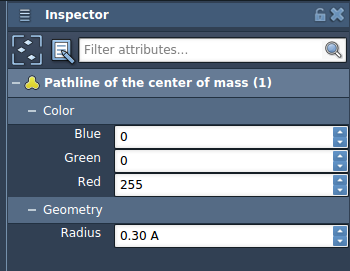
These controls help separate visual roles: for example, a more visible pathline can make the selected group’s route easier to distinguish from the surrounding structure. If you delete a path, its associated pathline is removed as well; deleting atoms used by a pathline modifies the visualization.
Make the visualization answer one question
Before creating a pathline, decide what you want to compare: a ligand’s route, a moving residue group, or a larger domain’s displacement. Select that group, then choose the relevant paths. This simple choice prevents a common source of confusion: a visualization that is technically correct but summarizes more of the system than you intended.
Pathlines can be used to inspect ligand unbinding or rebinding routes, collective domain motions, and COM movement in reaction-coordinate workflows. If you need to compute ligand paths, see Ligand Path Finder; for protein transition paths, see Protein Path Finder. To optimize paths, the documentation also points to the Parallel Nudged Elastic Band tutorial.
For the complete walkthrough, see the Pathlines tutorial.
Note: SAMSON and all SAMSON Extensions are free for non-commercial use. Get SAMSON.