



A molecular structure can show where atoms are at one moment. But when you are examining a path through multiple structures, a more useful question may be: how often do two groups appear at different distances from each other? That is the problem a radial distribution function (RDF) helps address.
For molecular modelers, distance plots can be easy to misread. A sharp feature may look meaningful, but its interpretation depends on what was measured, how distances were binned, and whether the curve has been normalized. An RDF gives you a way to explore local packing and characteristic separations between two atom-containing groups—while keeping those choices visible.
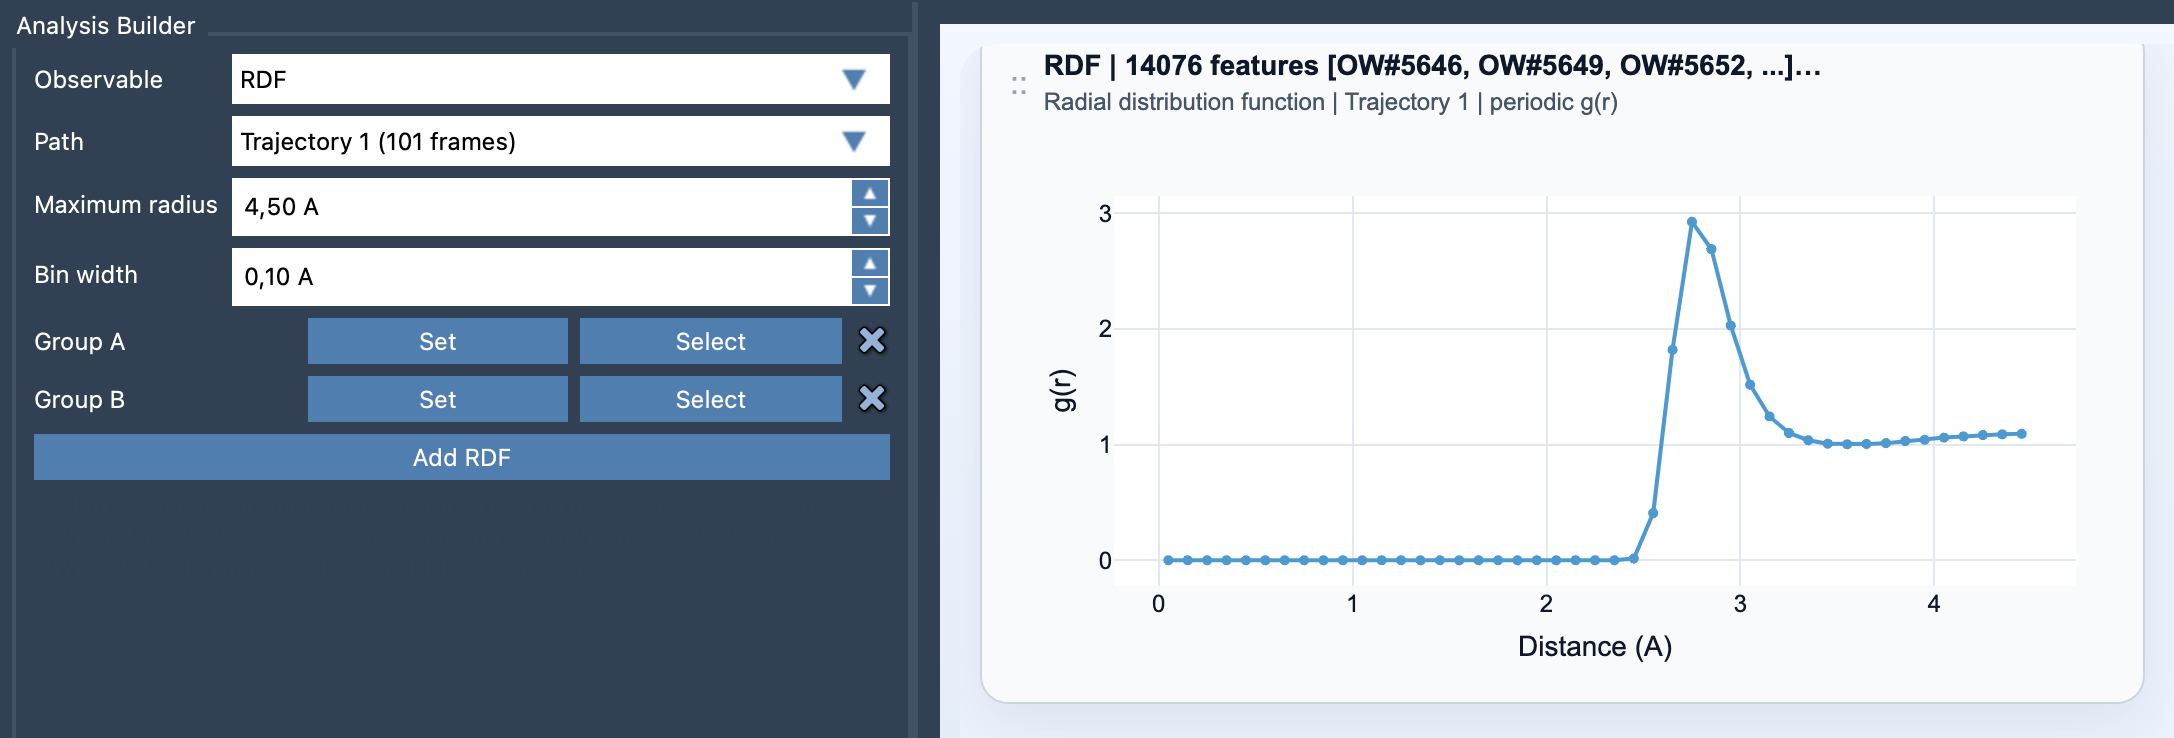
What the curve tells you
The RDF is a one-dimensional curve of density versus distance. In practical terms, it groups sampled pair distances into radial shells: pairs in one distance range contribute to one bin, pairs in another range contribute to another. The shell volume grows with distance, approximately as 4πr²Δr, so the number of pairs in a bin is considered in relation to the volume being sampled.
Peaks can help you identify distances at which the selected groups are commonly found relative to one another. For example, you might investigate solute–solvent organization, ligand–pocket contacts, or distances between selected residue groups. The curve is a summary of the path, not a per-frame view, so use it to look for overall distance patterns rather than to locate a feature in a specific frame.
Make the comparison meaningful
Start by deciding what molecular question you want the plot to answer. Choose two atom-containing selections that represent those groups, then select a path in Path Analyzer. For instance, a solute–solvent selection asks a different question from a ligand–pocket selection; the labels and membership of the groups are part of the result’s meaning.
Next, set the maximum radius and bin width. The maximum radius determines how far out the distribution is sampled. The bin width sets the radial resolution: smaller bins can show finer detail, but may make the curve noisier; larger bins smooth the distribution but can blur nearby features. There is no universally best width in the documentation, so treat it as an analysis choice. If a peak looks unstable or overly jagged, consider whether the bins are too fine for the data you are examining.
Once the settings are chosen, click Add RDF. Read the horizontal axis as distance and the curve as the distribution across those distances. Focus first on where features occur. Be more cautious when comparing their heights, especially if the curves were generated with different selections or settings.
Check the normalization before interpreting heights
When valid periodic unit-cell information is available, Path Analyzer can normalize the shell counts against the expected ideal-gas occupancy and report a properly scaled g(r). Without the information needed for periodic normalization, it falls back to an RDF-style curve in arbitrary units. The distance pattern can still be useful, but the vertical scale is not a normalized g(r). In particular, do not treat arbitrary-unit values as directly comparable normalized densities.
This distinction is worth checking before writing up or sharing a plot: a familiar-looking curve does not, by itself, tell you whether periodic normalization was possible. Also remember that RDF cards summarize the path globally and are not linked to individual frames.
A quick checklist
- Are Group A and Group B the atom-containing selections that match your question?
- Does the maximum radius cover the distances you want to inspect?
- Is the bin width fine enough to resolve the pattern without making the curve excessively noisy?
- Is the result a normalized
g(r), or an RDF-style curve in arbitrary units? - Are you interpreting it as a path-wide summary rather than a frame-specific measurement?
These checks make an RDF easier to use as evidence about local packing: not just “there is a peak,” but “this peak belongs to these groups, over this distance range, with this normalization.” To learn more about the RDF analysis and its inputs, see the SAMSON RDF documentation.
Note: SAMSON and all SAMSON Extensions are free for non-commercial use. Get SAMSON.