



A molecular trajectory can contain a lot of frames and still be hard to read. A protein may look nearly unchanged in a static view, while parts of it move rapidly; alternatively, a dramatic-looking path may include long stretches of little motion. If you need a quick way to locate bursts of movement and quieter regions, a per-frame average velocity can help.
What the average tells you
Path Analyzer’s Average velocity observable follows the mean velocity magnitude of a selected atom group along a path. At each frame, it takes the magnitude of each selected atom’s velocity and averages those values:
mean speed at frame t = (1 / number of selected atoms) × sum of |vₐ(t)|
This detail matters when interpreting the result. The calculation averages magnitudes, rather than first averaging the velocity vectors. So atoms moving in different directions do not cancel one another out in the average. The value is a measure of how fast the selected atoms are moving on average at that frame—not whether the group is moving together in one direction.
That makes the observable useful for scanning a trajectory for relative changes in motion. A rise can point to a period when the selected atoms are moving faster on average; a lower region indicates slower average motion for that selection. It does not, by itself, explain what caused the change or identify which atom contributed most.
Choose the group before interpreting the plot
The result depends on the atoms you select. A broad selection gives an average over all included atoms, while a smaller selection focuses the measurement on a particular atom-containing group. Keep the group consistent when comparing sections of a path, and make sure it matches the question you are asking. An average for one group should not be treated as a direct measurement of another.
The selected path must expose velocity data for the chosen atoms. If velocity information is unavailable, this analysis cannot provide the requested measurement. Average velocity is intended for trajectories with meaningful dynamical information, so check that the path represents motion you want to study rather than relying on appearance alone.
Build a useful view
- Open Path Analyzer.
- Choose Average velocity under Observable.
- Select the path and define the atom-containing group.
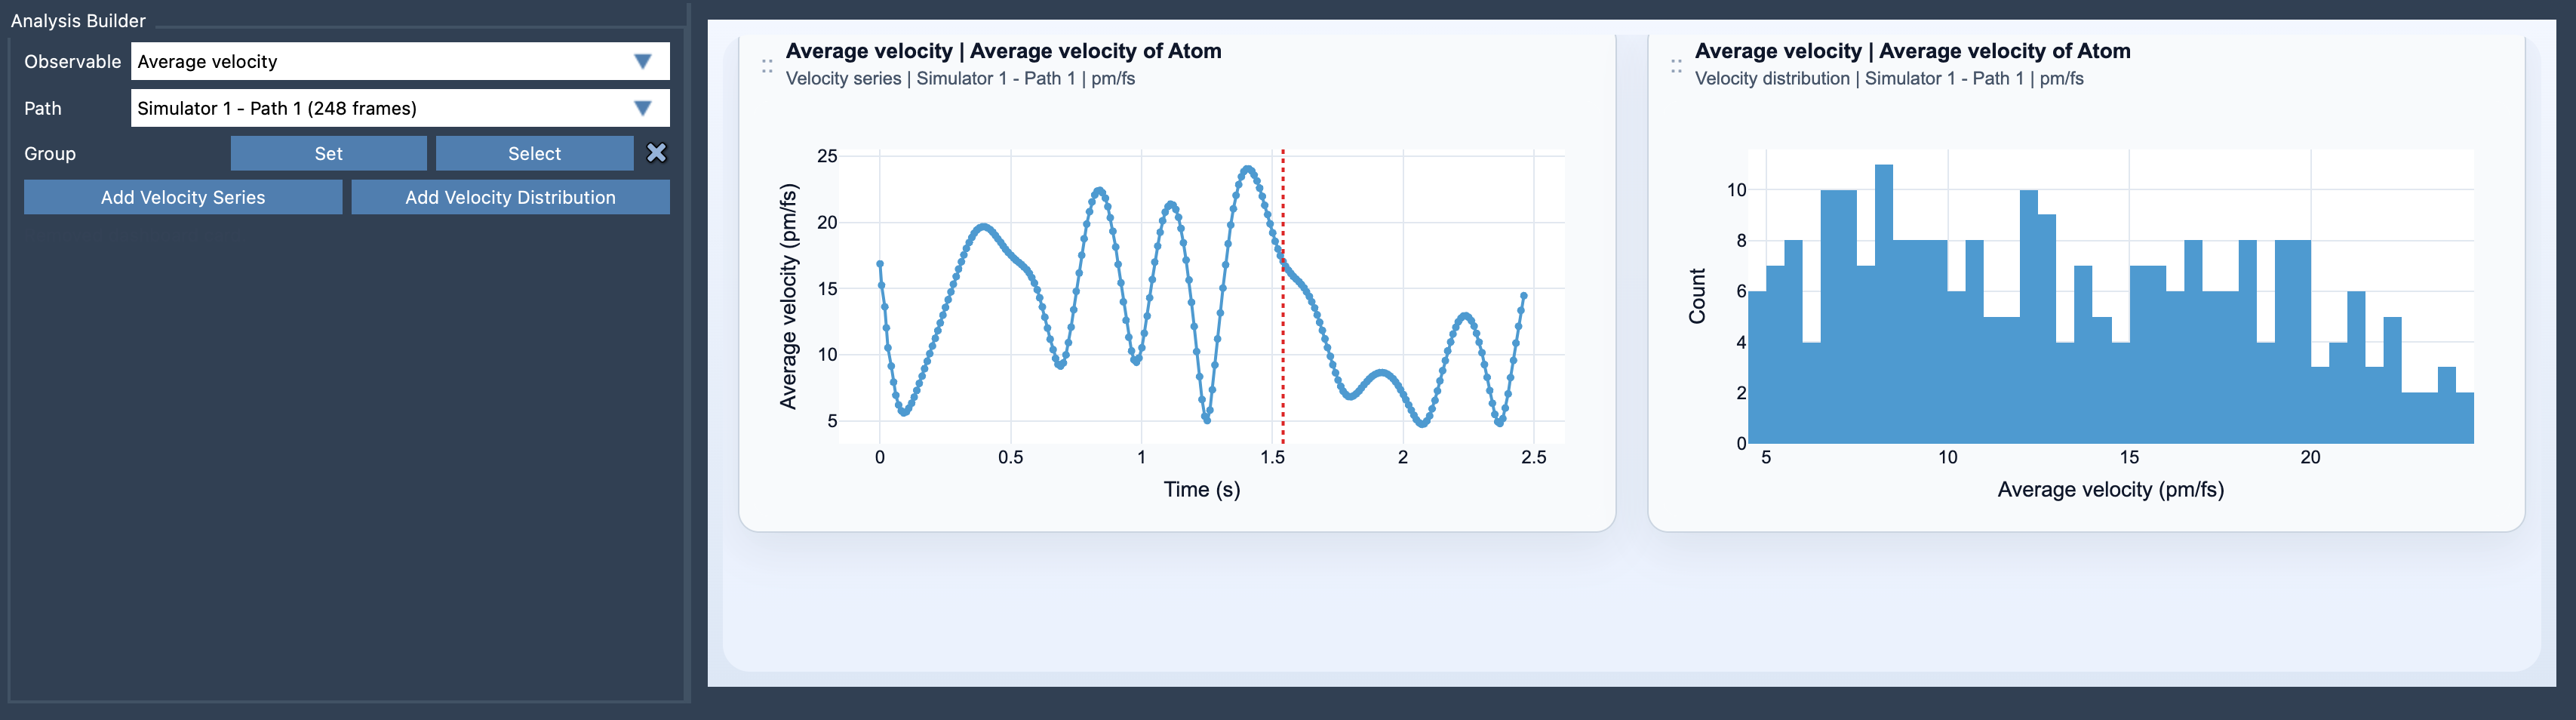
- Choose Add Velocity Series to follow the mean velocity magnitude along the path, or Add Velocity Distribution to inspect the sampled distribution.
The series is a natural starting point when your question is “where does motion rise or fall along this path?” The distribution offers another view of the sampled values. These are complementary ways to inspect the same observable; neither should be mistaken for a full explanation of the underlying molecular event.
Make comparisons carefully
When you spot a change, note the selected group and the units before comparing it with another plot or analysis. Units can be changed after creation between Auto, pm/fs, Å/ps, and m/s. A consistent unit choice makes comparisons easier to read. You can also compare average velocity with Average force to examine force and motion together. Treat that as a comparison, not proof that a particular force caused a particular velocity pattern.
Average velocity is most helpful as a focused diagnostic: choose a meaningful atom group, confirm the path includes velocity data, and use changes in the plot to decide where a closer investigation may be worthwhile. For the complete reference, see the Average Velocity documentation.
Note: SAMSON and all SAMSON Extensions are free for non-commercial use. Get SAMSON.