



A distance trace can look reassuringly simple: one line rises, falls, or stays flat. But in a moving molecular system, that line may tell very different stories depending on how the distance is defined. A group’s average position can move away while one atom pair forms a close contact—or the groups can shift together while their closest atoms barely change their separation.
This distinction matters when you are investigating questions such as: Is a binding site opening? Is a ligand approaching a residue? Are two domains moving apart, or is one specific contact breaking? Path Analyzer’s Distance observable lets you track two atom-containing selections along a path, but choosing the right distance type is essential for making the plot useful.
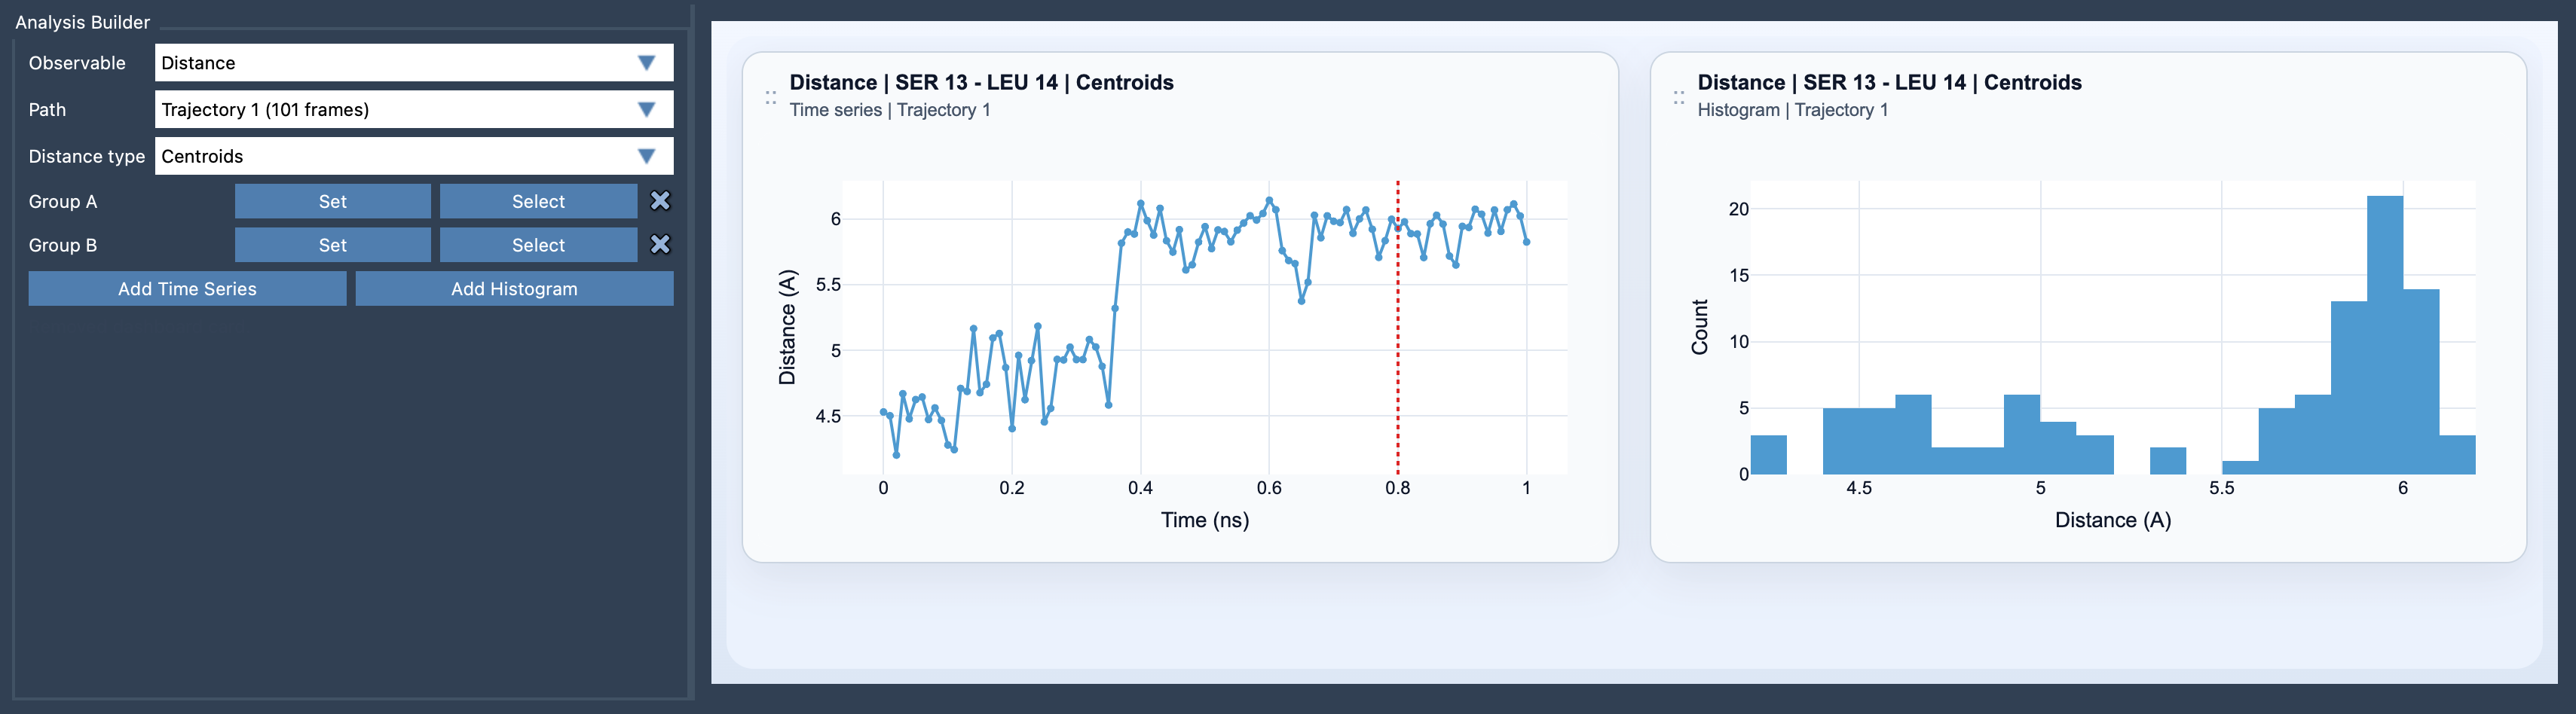
One plot, two different questions
In Centroids mode, each selection is represented by its centroid: the simple geometric average of the positions of its atoms. The plotted value is the distance between those two average positions. This gives a compact, often smooth description of how two groups move relative to one another.
That makes centroid distance useful for coarse-grained questions. For example, you might track the separation between two domains or compare the overall movement of a chain and a selected region. But a centroid is not an atom, and centroid distance does not report the closest contact. Atoms within either group can rearrange while the group’s average position stays similar.
In Minimum mode, Path Analyzer keeps the full atom sets and finds the smallest distance between any atom in Group A and any atom in Group B. This is the more direct choice when the question is about the closest approach or whether a particular contact becomes tighter or looser. The identity of the closest atom pair can change along the path, so interpret the result as the minimum separation between the selections—not necessarily as one persistent atom-pair interaction.
What the axis-specific options mean
Minimum along X, Minimum along Y, and Minimum along Z measure the smallest separation between the groups’ atom coordinates along the chosen axis. These are projected, one-dimensional separations, not full three-dimensional distances. They can help diagnose motion along a direction of interest, but they should not be read as ordinary contact distances: two atoms may be close along X while still being far apart in Y or Z.
A practical way to choose is to start with the scientific question:
- Overall group motion: choose
Centroids. - Closest approach or contact: choose
Minimum. - Movement along a preferred direction: compare the relevant axis-specific minimum, while remembering that it describes only that coordinate.
Make the comparison interpretable
Selection size changes what a minimum means. A large selection contains many possible atom pairs, so its minimum can be governed by one local pair even if the rest of the groups are far apart. A small, chemically focused selection can make contact tracking easier to interpret. Conversely, residues, domains, or chains are often more appropriate when the goal is to describe broad motion rather than a specific interaction.
Also decide whether you need to know when a change occurs. A time series preserves the order of distances along the path, making it useful for following an opening, closing, or approach. A histogram summarizes the distribution of sampled distances, which can help compare how often values occur, but it does not show their sequence. If timing matters, use the time series as your primary view.
For a clearer analysis, define both groups deliberately, choose a distance type that matches the question, and avoid treating a centroid signal as a contact measurement—or a projected axis distance as a full spatial separation. Saved Distance analyses can also be used as inputs to Custom scatter, 2D density map, or Energy landscape analyses when you want to compare distance with another observable.
Learn more in the Distance analysis documentation.
Note: SAMSON and all SAMSON Extensions are free for non-commercial use. Get SAMSON.