


When working on molecular modeling tasks, grasping how the shape of a molecular structure changes over a trajectory or path is crucial. This brings us to one of the challenges faced by many molecular modelers: effectively monitoring and analyzing deviations from spherical shapes. A simple radius of gyration metric often falls short in providing the nuanced details needed for reliable insights.
Enter the Asphericity analysis in SAMSON: an intuitive solution for shape anisotropy monitoring. If you’re looking for a way to assess group shape deviations without reducing complexity to mere distance metrics, asphericity might be what you need.
What is Asphericity?
Asphericity measures how far a group, such as an atom selection, deviates from a perfectly spherical shape along a given path or trajectory. This makes it more compact and useful for anyone who needs a deeper understanding of shape anisotropy in molecular systems.
Ultimately, this metric allows modelers to quantify shape variations systematically and detect changes in shape that are potentially significant for molecular function, structural stability, or other phenomena of interest.
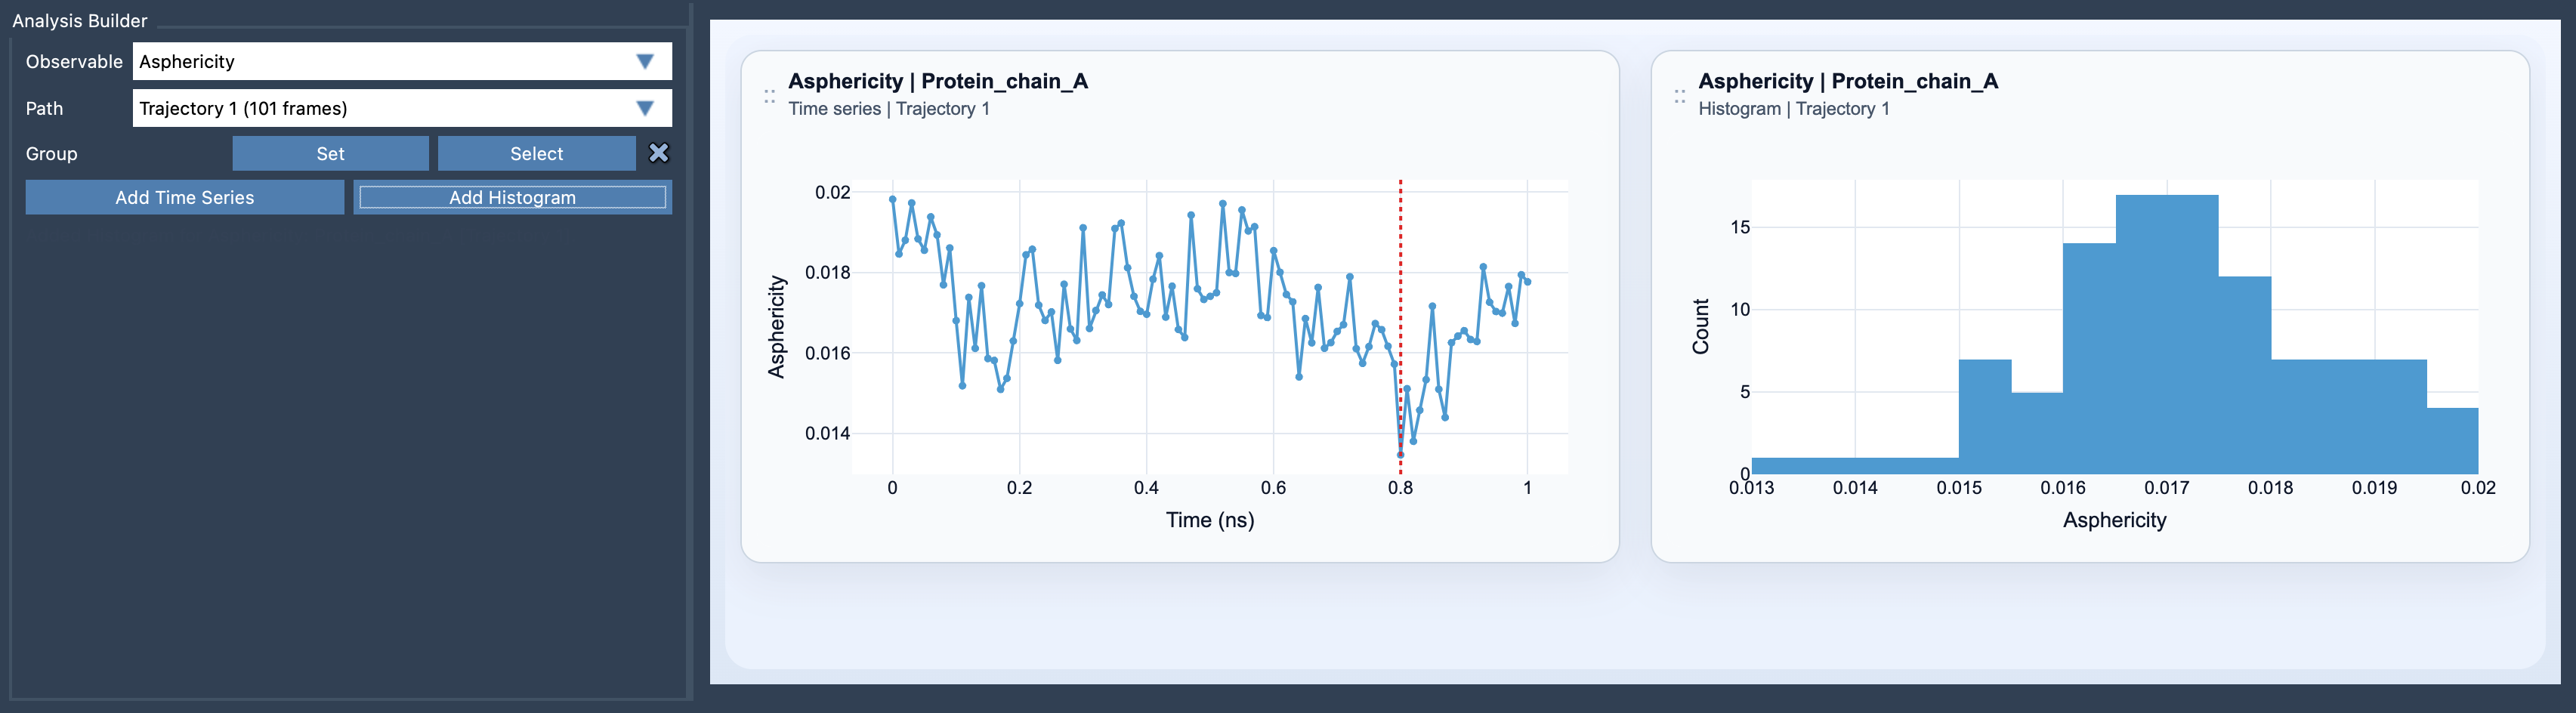
How to Add an Asphericity Plot
Creating an asphericity plot in SAMSON is a straightforward process. Here’s how you can get started:
- Open the Path Analyzer in SAMSON.
- Select Asphericity in the Observable option.
- Choose a Path that you want to analyze.
- Define the Group of atoms whose shape changes you aim to track.
- Click Add Time Series to examine the changes over time, or Add Histogram to inspect the range of sampled values.
This intuitive workflow not only enables you to explore asphericity visually and dynamically but also ensures you can focus on the specific data points relevant for your study.
Tips for Maximizing Insights
To get the most out of asphericity analysis:
- Combine it with other valuable shape descriptors like Radius of Gyration and Shape Parameter. This will enrich your overall understanding of global shape changes.
- Utilize asphericity when simpler metrics feel too broad or imprecise. It provides the intermediate view between simplicity and oversimplification.
Visual Insights through Views
SAMSON’s Path Analyzer supports two distinct views for analyzing asphericity outputs:
- Time series: This view helps you observe shape descriptor variations over the path or trajectory, helping connect structural behavior with functional insights.
- Histogram: By focusing on the distribution of shape values, histograms let you inspect the range of sampling data and spot potentially meaningful patterns.
Visualizing asphericity in these ways can simplify the interpretation of your results and provide clarity on how molecular shape evolves.
Conclusion
Asphericity is a powerful yet straightforward tool in SAMSON for anyone interested in tracking shape anisotropy in molecular modeling tasks. Whether you’re aiming to quantify structural differences or enrich your analysis with complementary metrics, the asphericity analysis provides an effective way to do so.
To learn more about the details and applications of asphericity, please refer to the complete documentation at this link.
Note: SAMSON and all SAMSON Extensions are free for non-commercial use. You can get SAMSON at https://www.samson-connect.net.