



In the world of molecular modeling, tracking dynamic conformational changes can often feel like a daunting task. If you’ve ever struggled to analyze rotamers or backbone torsions or wished for better insights into the collective twisting motions of molecules, SAMSON’s Dihedral analysis tool may be the exact solution you’re looking for!
What is Dihedral Analysis?
Dihedral analysis in SAMSON is a powerful feature that calculates torsion angles defined by four selected groups (atoms or multi-atom groups) along a molecular path or trajectory. This tool is particularly well-suited for monitoring molecular characteristics like:
- Rotamers and their transitions
- Backbone torsion angles
- Collective twisting motions
For researchers and modelers, this functionality enables efficient tracking and visualization of key structural changes that affect molecular behavior.
Setting Up a Dihedral Plot
The Dihedral feature in SAMSON integrates seamlessly into your molecular analysis process. Here’s a step-by-step guide to creating a torsion angle plot:
- Open the Path Analyzer tool within SAMSON.
- Select Dihedral from the list of observables.
- Specify a Path—this could represent a trajectory or series of molecular states.
- Define the groups: Group A, Group B, Group C, and Group D. These groups define the atoms that influence the central torsion angle.
- Choose between two visualization options: Add Time Series (to track torsion changes over time) or Add Histogram (to observe the distribution of torsion states).
In just five steps, you can generate insightful plots that reveal torsion behaviors and conformational trends.
How It Works
SAMSON’s Dihedral analysis converts atom groups into representative positions to make the computations seamless:
- If a group contains a single atom, the atomic position is used directly.
- For multi-atom groups, the center of mass becomes the representative position.
These representative positions are then used to compute the torsion angle. The resulting plots deliver angles in degrees, making it straightforward to interpret transitions and stable states.
The Visualization Options
The Dihedral feature includes two visualization modes to fit different analysis needs:
- Time Series: This option allows you to follow torsional transitions over time, making it easy to pinpoint when key conformational changes occur.
- Histogram: This provides an overview of preferred torsional states, enabling quicker identification of metastable conformations.
Combining these tools can help you not only detect transitions but also map them to broader structural or energetic patterns.
Pro Tips for Enhanced Analysis
- Use the histogram view for an instant snapshot of metastable conformations.
- Leverage the time series view to precisely locate torsional transitions along your path or trajectory.
- Pair the Dihedral analysis with other metrics like RMSD or Energy for a holistic understanding of conformation changes and their energetic impacts.
See It in Action
Here’s an example of how the Dihedral analysis looks when applied:
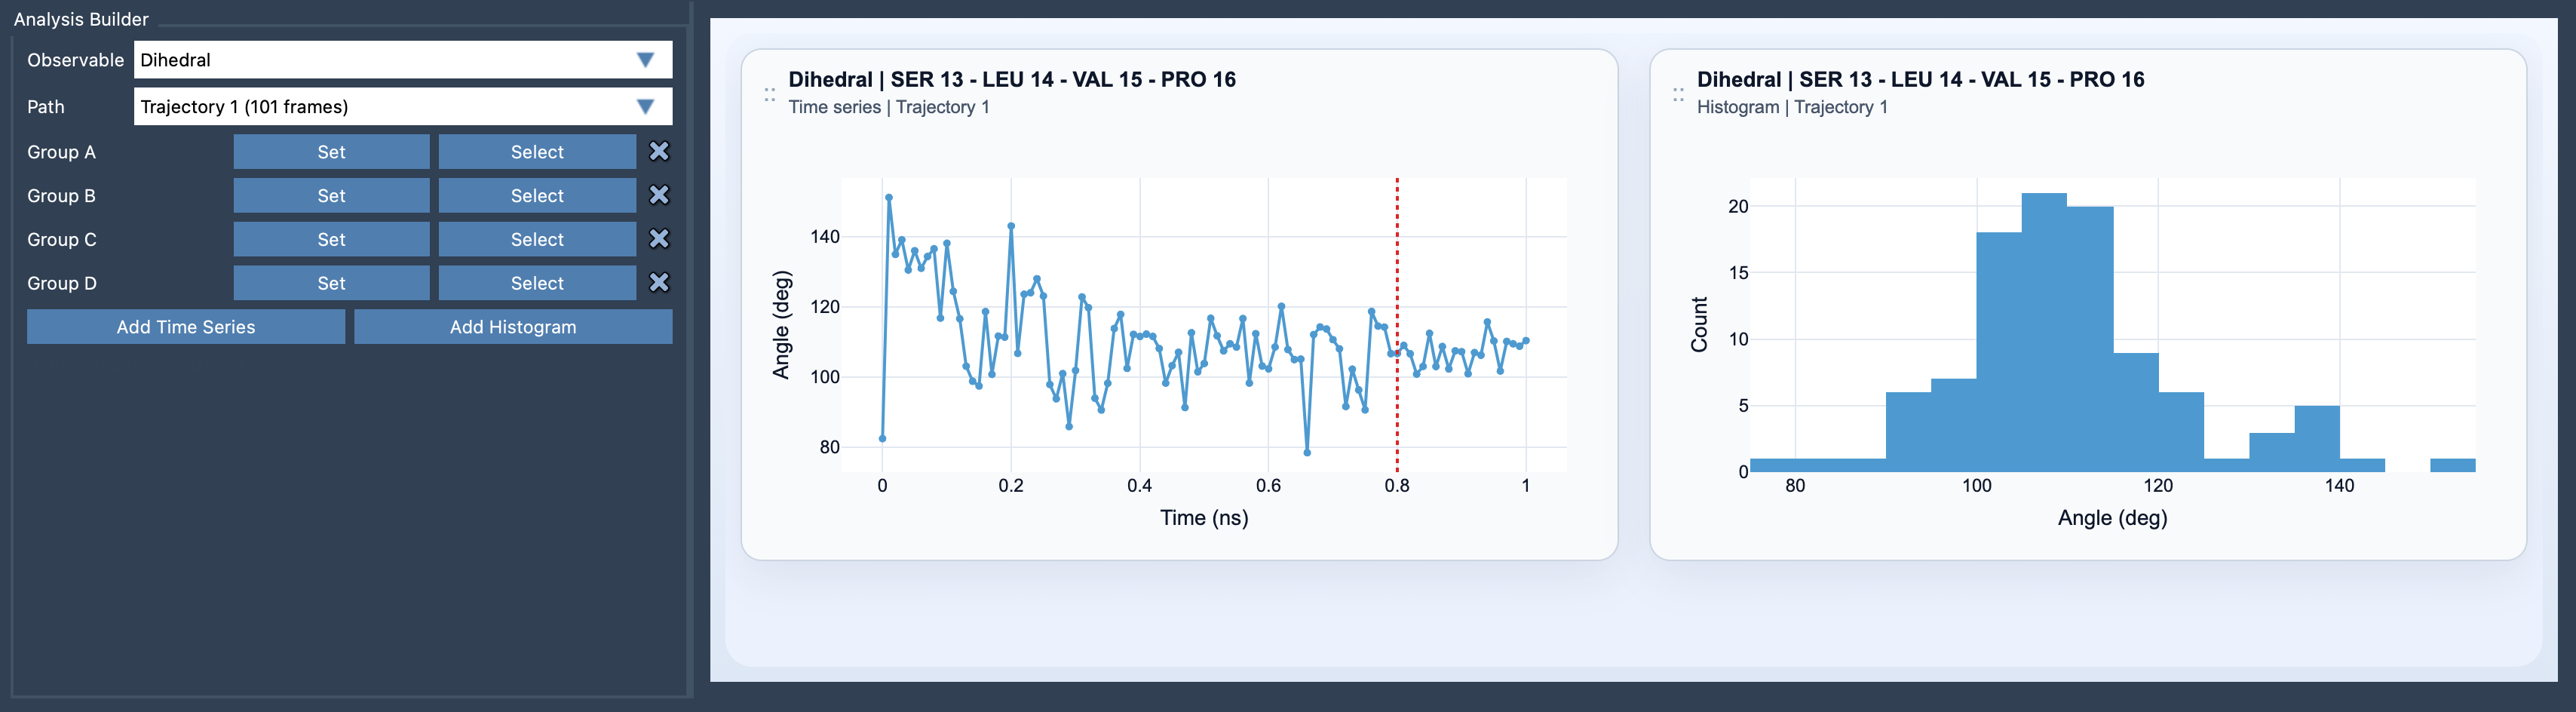
The combination of advanced calculations and intuitive visualization allows you to efficiently analyze conformational changes and make data-driven decisions in your research projects.
Interested in learning more about how to use Dihedral analysis? Visit the official documentation page here: Dihedral Documentation.
SAMSON and all SAMSON Extensions are free for non-commercial use. To get started, download SAMSON from SAMSON Connect.