



For molecular modelers, ensuring the structural integrity of proteins is critical, whether you’re refining a homology model or preparing a structure for simulation. One key challenge often faced is identifying and correcting strained residues in a protein structure. This is where the Ramachandran Plot within SAMSON can make a significant impact, offering a highly visual and interactive means of exploring protein backbone conformations.
The Basics: What is a Ramachandran Plot?
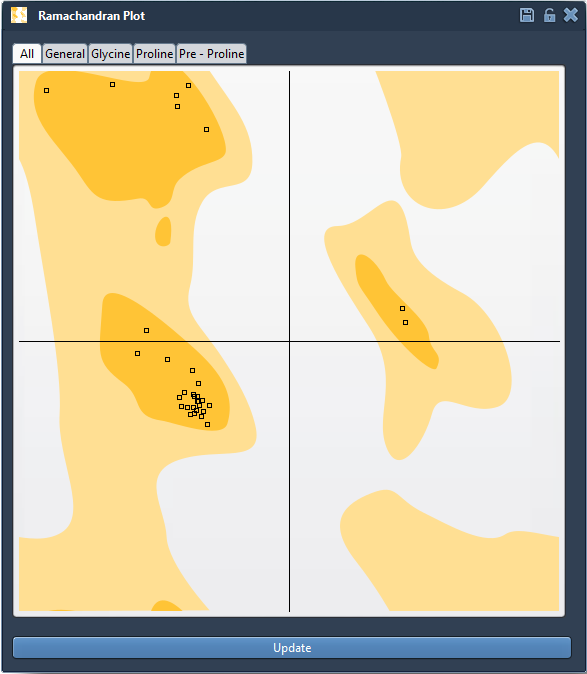
Before diving into how to use the Ramachandran Plot in SAMSON, let’s briefly touch on its purpose. The plot maps the φ (phi) and ψ (psi) dihedral angles of amino acid residues in a protein’s backbone. Energetically favorable regions appear as yellow zones, whereas strained, unfavorable areas are white. This map becomes a vital tool for detecting residues that might disrupt stability or functionality.
Getting Started with SAMSON’s Ramachandran Plot App
SAMSON’s Interactive Ramachandran Plot Extension simplifies the process of inspecting and fine-tuning protein conformations. Follow these steps to kickstart your exploration:
- Log into SAMSON Connect and add the Interactive Ramachandran Plot Extension from its respective page.
- Restart SAMSON to activate the extension.
- Load a protein structure. For instance, a quick search for PDB ID
1YRFusing the Home > Fetch menu will load it directly into the viewport. - Open the Ramachandran Plot app by navigating to Home > Apps > Biology > Ramachandran Plot. Click Update to generate the plot.
Exploring Protein Residues
Once the plot is generated, you can start inspecting individual residues:
- Each dot on the plot represents a residue in the protein backbone. Clicking on a dot highlights the corresponding residue in the 3D viewport, making identification seamless.
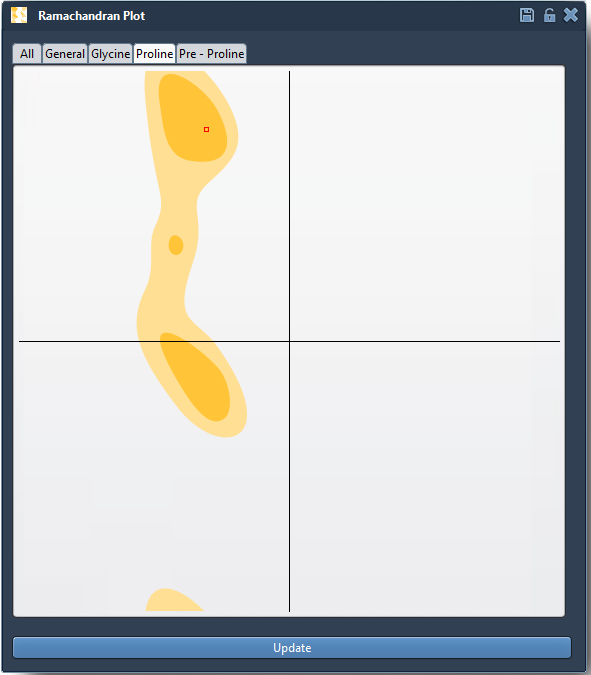
- You can view detailed dihedral angle values (φ and ψ) in the status bar. For example, selecting a proline residue will display its specific angles.
Real-Time Edits for Protein Optimization
What sets SAMSON apart is its interactivity. Here are two ways to refine residues directly within the platform:
Option 1: Dragging Within the Plot
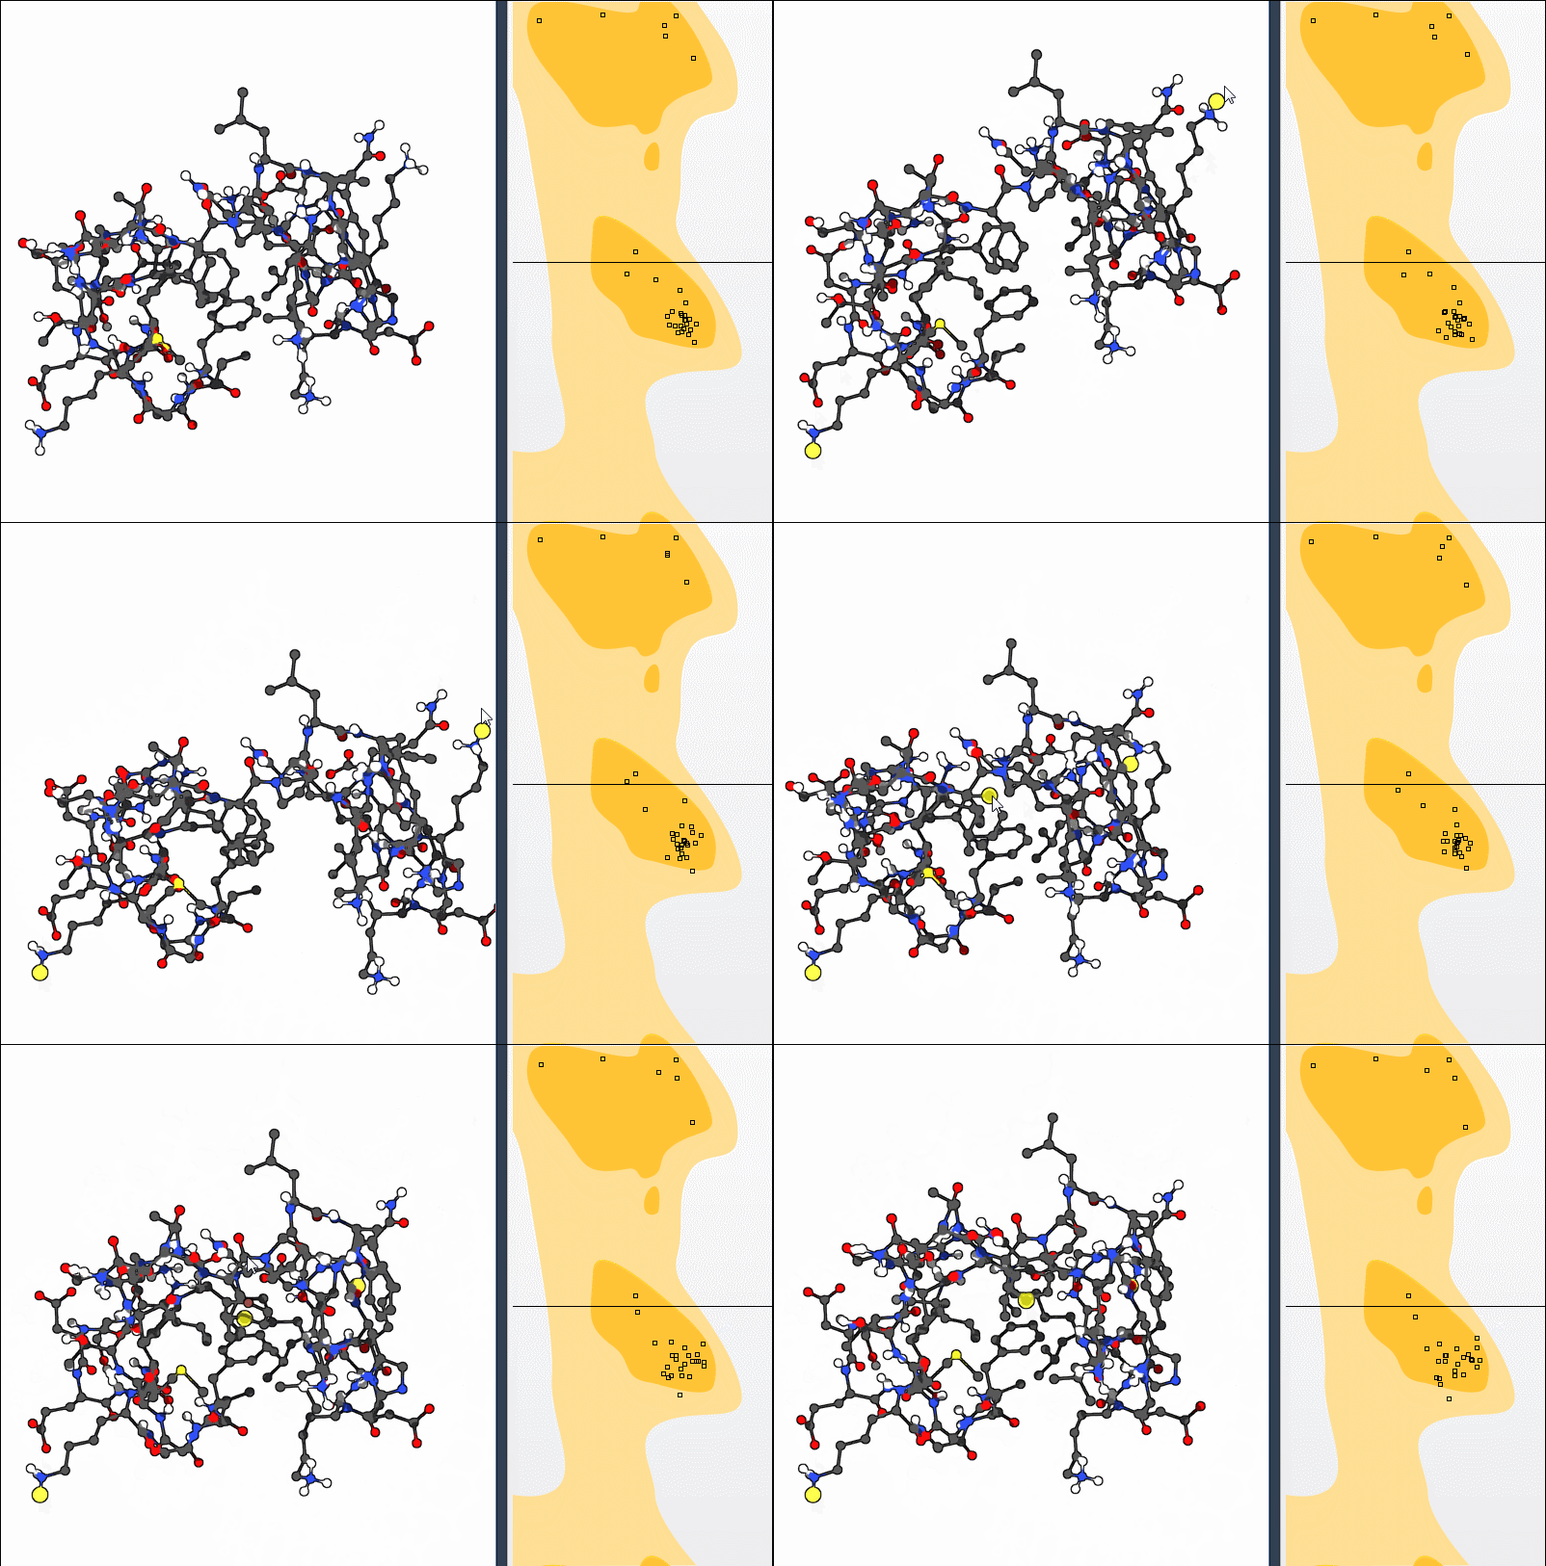
Simply drag a dot on the plot to adjust φ and ψ angles instantly. The 3D structure updates in real time, offering immediate feedback on the conformational changes.
Option 2: The Twister Editor
Using the Twister Editor tool, you can manually twist the protein backbone in 3D space. The changes reflect directly on the Ramachandran Plot, allowing you to visualize correlations between local edits and global structural positioning.
Why Use the Ramachandran Plot?
The Ramachandran Plot streamlines significant modeling tasks, enabling you to:
- Identify and refine strained residues before simulations, preventing computational errors.
- Polish homology models by editing outliers and non-native conformations.
- Dive into structural flexibility analysis, especially in active or binding site regions.
This tool provides a bridge between visualization and hands-on editing, making it a valuable addition to your molecular modeling toolbox.
To explore the full potential of SAMSON’s Interactive Ramachandran Plot Extension, visit the detailed documentation here.
Note: SAMSON and all SAMSON Extensions are free for non-commercial use. You can download SAMSON at www.samson-connect.net.